Tingwei Adeck December 19, 2023
The goal of {tidyDenovix}
is to clean data obtained from the Denovix spectrophotometry instrument.
This package should clean data for RNA or DNA samples. At the moment
users should use the ‘lax’ option for quality control.
You can install the development version of tidyDenovix from GitHub with:
# install.packages("devtools")
devtools::install_github("AlphaPrime7/tidyDenovix")This is a basic example which shows you how to solve a common problem:
library(tidyDenovix)
## basic example code
fpath <- system.file("extdata", "rnaspec2018.csv", package = "tidyDenovix", mustWork = TRUE)
rna_data = tidyDenovix(fpath, file_type = 'csv', sample_type = 'RNA', check_level = 'lax')This examples implements normalization for Quality Control of RNA isolates:
library(tidyDenovix)
## basic example code
fpath <- system.file("extdata", "rnaspec2018.csv", package = "tidyDenovix", mustWork = TRUE)
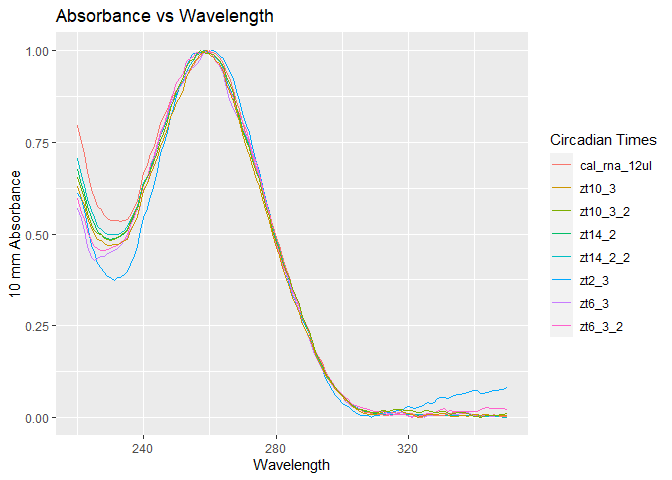
rna_data = tidyDenovix(fpath, sample_type = 'RNA',check_level = 'strict', qc_omit = 'no', normalized = 'yes')Visualization of normalized data for QC. Spectrophotometry can help in knowing if the sample in hand is RNA vs DNA but that is not the most sound approach. More will be discussed below on this.
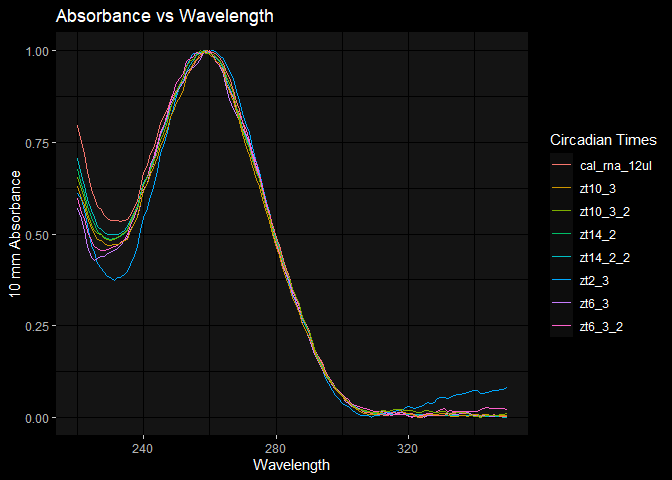
Simply look for samples that look different and “viola” those are your problems. These samples will not be primed candidates for cDNA synthesis and most likely not useful for qPCR.
The other aspect of QC will be ensuring that the kit used in RNA isolation is the right kit and actually yields RNA. This can only be done using gel electrophoresis and this is NOT the scope of this package OR is it even possible using this package. The user will need to physically run gels and confirm the presence of rRNA bands. In fact, it is resource smart to run gels first to confirm you have the right type of sample before determining if the samples meet the right quality needed for further probing.
library(tidyDenovix)
## basic example code
fpath <- system.file("extdata", "rnaspec2018.csv", package = "tidyDenovix", mustWork = TRUE)
rna_data = tidyDenovix(fpath, sample_type = 'RNA',check_level = 'strict', qc_omit = 'no', normalized = 'yes')

#PLOT-rnaspec2018.csv 'strict'
library(ggplot2)
library(plotly)
library(htmlwidgets)
rnaqcplot = ggplot(rna_data, aes(x=wave_length)) +
  geom_line(aes(y=zt2_3, color='zt2_3')) +
  geom_line(aes(y=zt14_2, color='zt14_2')) +
  geom_line(aes(y=zt14_2_2, color='zt14_2_2')) +
  geom_line(aes(y=cal_rna_12ul, color='cal_rna_12ul')) +
  geom_line(aes(y=zt6_3, color='zt6_3'))  +
  geom_line(aes(y=zt6_3_2, color='zt6_3_2')) +
  geom_line(aes(y=zt10_3, color='zt10_3')) +
  geom_line(aes(y=zt10_3_2, color='zt10_3_2')) +
  labs(title = 'Absorbance vs Wavelength', x = 'Wavelength', y='10 mm Absorbance', color='Circadian Times')
#saveWidget(ggplotly(rnaqcplot), file = "rnaplot.html", selfcontained = F, libdir = "lib")
#ggplotly(rnaqcplot)
rnaqcplot
#PLOT dark mode-rnaspec2018.csv 'strict'
library(ggplot2)
library(plotly)
library(ggdark)
library(ggthemes)
library(htmlwidgets)
library(widgetframe)
#library(hrbrthemes)
#old <- theme_set(theme_dark())
rnaqcplot = ggplot(rna_data, aes(x=wave_length)) +
  geom_line(aes(y=zt2_3, color='zt2_3')) +
  geom_line(aes(y=zt14_2, color='zt14_2')) +
  geom_line(aes(y=zt14_2_2, color='zt14_2_2')) +
  geom_line(aes(y=cal_rna_12ul, color='cal_rna_12ul')) +
  geom_line(aes(y=zt6_3, color='zt6_3'))  +
  geom_line(aes(y=zt6_3_2, color='zt6_3_2')) +
  geom_line(aes(y=zt10_3, color='zt10_3')) +
  geom_line(aes(y=zt10_3_2, color='zt10_3_2')) +
  dark_mode() +
  labs(title = 'Absorbance vs Wavelength', x = 'Wavelength', y='10 mm Absorbance', color='Circadian Times')
#saveWidget(ggplotly(rnaqcplot), file = "rnaplot.html", selfcontained = F, libdir = "lib")
#frameWidget(ggplotly(rnaqcplot))
#ggplotly(rnaqcplot)
rnaqcplot
(Dowle and Srinivasan 2023) (Firke 2023) (Wickham et al. 2019)