| Type: | Package |
| Title: | Analysing 'SNP' and 'Silicodart' Data - Basic Functions |
| Version: | 1.3.0 |
| Date: | 2026-11-18 |
| Revision: | Hardy Hedgehog |
| Description: | Facilitates the import and analysis of 'SNP' (single nucleotide 'polymorphism') and 'silicodart' (presence/absence) data. The main focus is on data generated by 'DarT' (Diversity Arrays Technology), however, data from other sequencing platforms can be used once 'SNP' or related fragment presence/absence data from any source is imported. Genetic datasets are stored in a derived 'genlight' format (package 'adegenet'), that allows for a very compact storage of data and metadata. Functions are available for importing and exporting of 'SNP' and 'silicodart' data, for reporting on and filtering on various criteria (e.g. 'callrate', 'heterozygosity', 'reproducibility', maximum allele frequency). Additional functions are available for visualization (e.g. Principle Coordinate Analysis) and creating a spatial representation using maps. 'dartR.base' is the 'base' package of the 'dartRverse' suits of packages. To install the other packages, we recommend to install the 'dartRverse' package, that supports the installation of all packages in the 'dartRverse'. If you want to cite 'dartR', you find the information by typing citation('dartR.base') in the console. |
| Encoding: | UTF-8 |
| Depends: | R (≥ 4.1), adegenet (≥ 2.0.0), ggplot2, dplyr, dartR.data (≥ 1.2.7) |
| Imports: | ape,crayon,data.table,foreach,methods,patchwork,plyr, reshape2,SNPRelate,StAMPP,stats,stringr,tidyr,utils, bigstatsr, bigsnpr, snpStats |
| Suggests: | boot, devtools, directlabels, dismo, doParallel, expm, gdistance, gdsfmt, gganimate, ggrepel, grid, gtable, ggthemes, gplots, HardyWeinberg, hierfstat, igraph, iterpc, knitr, label.switching, lattice, leaflet, leaflet.minicharts, markdown, mmod, networkD3, parallel, pegas, pheatmap, plotly, poppr, proxy, purrr, qvalue, RColorBrewer, Rcpp, RcppParallel, rgl, rmarkdown, rrBLUP, scales, seqinr, sf, shinyBS, shinyjs, shinythemes, shinyWidgets, SIBER, stringi, tibble, vcfR, zoo, viridis, fields, testthat (≥ 3.0.0), ggtern, dendextend, ggdendro, terra, R.utils, tidypopgen |
| License: | GPL (≥ 3) |
| RoxygenNote: | 7.3.3 |
| NeedsCompilation: | no |
| Packaged: | 2026-11-18 04:59:08 UTC; s425824 |
| Author: | Bernd Gruber [aut, cre], Arthur Georges [aut], Jose L. Mijangos [aut], Carlo Pacioni [aut], Diana Robledo-Ruiz [aut], Peter J. Unmack [ctb], Oliver Berry [ctb], Lindsay V. Clark [ctb], Emily Stringer [ctb], Floriaan Devloo-Delva [ctb], Eric Archer [ctb], Ching Ching Lau [ctb] |
| URL: | https://green-striped-gecko.github.io/dartR/ |
| BugReports: | https://groups.google.com/g/dartr?pli=1 |
| Maintainer: | Bernd Gruber <bernd.gruber@canberra.edu.au> |
| Repository: | CRAN |
| Date/Publication: | 2026-11-18 06:00:02 UTC |
indexing dartR objects correctly...
Description
indexing dartR objects correctly...
Usage
## S4 method for signature 'dartR,ANY,ANY,ANY'
x[i, j, ..., pop = NULL, treatOther = TRUE, quiet = TRUE, drop = FALSE]
Arguments
x |
dartR object |
i |
index for individuals |
j |
index for loci |
... |
other parameters |
pop |
list of populations to be kept |
treatOther |
elements in other (and ind.metrics & loci.metrics) as indexed as well. default: TRUE. The matrices in other$geno.metrics (individuals x loci) are always subset by individuals and loci. |
quiet |
warnings are suppressed. default: TRUE |
drop |
reduced to a vector if a single individual/loci is selected. default: FALSE [should never set to TRUE] |
Value
dartR object
cbind for dartR objects
Description
cbind is a bit lazy and does not take care for the metadata (so data in the other slot is lost). You can get most of the loci metadata back using gl.compliance.check.
Usage
## S3 method for class 'dartR'
cbind(..., backingfile = NULL, code = NULL, chunk = 2048L, quiet = TRUE)
Arguments
... |
list of dartR objects |
backingfile |
File stem for the backing file of the resulting FBM, or NULL for a temporary file in getOption("FBM.dir") [default NULL] |
code |
code mapping to use for the resulting FBM=CODE_012; if NULL, inherits from the first FBM input |
chunk |
number of columns to process in a block when copying from FBMs |
quiet |
suppress warnings. default: TRUE |
Value
A dartR object
Examples
t1 <- platypus.gl
t2 <- cbind(t1[,1:10],t1[,11:20])
Converts a genind object into a genlight object
Description
Converts a genind object (package adegenet) containing biallelic SNP data into a genlight object, retaining individual names, populations and the contents of the other slot.
Usage
gi2gl(gi, parallel = FALSE, verbose = NULL)
Arguments
gi |
A genind object [required]. |
parallel |
Switch to deactivate parallel version. It might not be worth to run it parallel most of the times [default FALSE]. |
verbose |
Verbosity: 0, silent or fatal errors; 1, begin and end; 2, progress log; 3, progress and results summary; 5, full report [default NULL, adopting the global verbosity set by gl.set.verbosity(), or 2 if no global is set]. |
Details
Only diploid genind objects with at most two alleles per locus can be converted; loci with more than two alleles cannot be represented in a genlight object and raise a fatal error naming the offending loci.
Allele spellings are reconstructed from the genind allele names: each
locus receives loc.all of the form second/first allele of the
genind tab, so the 0/1/2 dosages and the allele pair are mutually
consistent. Be aware that due to ambiguity over which allele is the
reference, a combination of gi2gl(gl2gi(gl)) does not return an
identical object (loci can come back with the complementary dosage and
the reversed allele pair), but in terms of analysis the conversions
are equivalent.
Value
A genlight object, with all slots filled.
Author(s)
Author(s): Bernd Gruber. Custodian: Bernd Gruber – Post to https://groups.google.com/d/forum/dartr
See Also
Other linker:
gl2bayesAss(),
gl2bayescan(),
gl2bpp(),
gl2demerelate(),
gl2eigenstrat(),
gl2faststructure(),
gl2gapit(),
gl2gds(),
gl2genalex(),
gl2genepop(),
gl2geno(),
gl2gi(),
gl2hapmap(),
gl2hiphop(),
gl2related(),
gl2snapper(),
gl2structure(),
gl2treemix(),
gl2vcf()
Examples
gi <- gl2gi(gl.filter.allna(testset.gl[1:20, 1:50], verbose = 0),
            verbose = 0)
gl <- gi2gl(gi, verbose = 0)
Estimates expected heterozygosity for each locus
Description
Calculates the expected heterozygosity at each locus under Hardy-Weinberg proportions, He = 2p(1-p), with the allele frequency p estimated from the mean allele dosage pooled across all individuals in the genlight object.
Usage
gl.He(gl)
Arguments
gl |
A genlight object containing SNP genotypes [required]. |
Details
This is a silent pure accessor: it returns the per-locus vector directly
(visibly), produces no console output and does not modify the input. The
estimate carries no sample-size correction — for unbiased expected
heterozygosity (uHe) averaged within populations, use
gl.report.heterozygosity.
Loci with all genotypes missing return NaN. The function applies to SNP genotype data only.
Value
A named vector with the expected heterozygosity for each locus.
Author(s)
Author(s): Bernd Gruber. Custodian: Bernd Gruber (Post to https://groups.google.com/d/forum/dartr)
See Also
gl.Ho, gl.alf,
gl.report.heterozygosity
Other utilities:
gl.Ho(),
gl.alf(),
utils.allelic.richness(),
utils.basic.stats(),
utils.check.datatype(),
utils.collapse.matrix(),
utils.dart2genlight(),
utils.dist.binary(),
utils.fbm.amat(),
utils.fbm.blocks(),
utils.fbm.colblocks(),
utils.fbm.colwise(),
utils.fbm.copy(),
utils.fbm.count.mean(),
utils.fbm.decode(),
utils.fbm.grm(),
utils.fbm.has(),
utils.fbm.new(),
utils.fbm.pair.counts(),
utils.fbm.reader(),
utils.fbm.rowwise(),
utils.fbm.tempfile(),
utils.flag.start(),
utils.het.pop(),
utils.history.call(),
utils.is.fixed(),
utils.jackknife(),
utils.n.var.invariant(),
utils.plot.save(),
utils.read.fasta(),
utils.read.ped(),
utils.recalc.avgpic(),
utils.recalc.callrate(),
utils.recalc.freqhets(),
utils.recalc.freqhomref(),
utils.recalc.freqhomsnp(),
utils.recalc.maf(),
utils.reset.flags(),
utils.transpose(),
utils.vcf.depth(),
utils.vcfr2genlight.polyploid()
Examples
pp <- possums.gl[1:30,1:20]
if (isTRUE(getOption("dartR_fbm"))) pp <- gl.gen2fbm(pp)
gl.He(pp)
Estimates observed heterozygosity for each locus
Description
Calculates the observed heterozygosity at each locus, pooled across all individuals in the genlight object, as the proportion of individuals scored as heterozygous at that locus.
Usage
gl.Ho(gl)
Arguments
gl |
A genlight object containing SNP genotypes [required]. |
Details
This is a silent pure accessor: it returns the per-locus vector directly
(visibly), produces no console output and does not modify the input. For
heterozygosities averaged within populations or by individual, with
sample-size corrections and plots, use
gl.report.heterozygosity.
Loci with all genotypes missing return NaN. The function applies to SNP genotype data only.
Value
A named vector with the observed heterozygosity for each locus.
Author(s)
Author(s): Bernd Gruber. Custodian: Bernd Gruber (bugs? Post to https://groups.google.com/d/forum/dartr)
See Also
gl.He, gl.alf,
gl.report.heterozygosity
Other utilities:
gl.He(),
gl.alf(),
utils.allelic.richness(),
utils.basic.stats(),
utils.check.datatype(),
utils.collapse.matrix(),
utils.dart2genlight(),
utils.dist.binary(),
utils.fbm.amat(),
utils.fbm.blocks(),
utils.fbm.colblocks(),
utils.fbm.colwise(),
utils.fbm.copy(),
utils.fbm.count.mean(),
utils.fbm.decode(),
utils.fbm.grm(),
utils.fbm.has(),
utils.fbm.new(),
utils.fbm.pair.counts(),
utils.fbm.reader(),
utils.fbm.rowwise(),
utils.fbm.tempfile(),
utils.flag.start(),
utils.het.pop(),
utils.history.call(),
utils.is.fixed(),
utils.jackknife(),
utils.n.var.invariant(),
utils.plot.save(),
utils.read.fasta(),
utils.read.ped(),
utils.recalc.avgpic(),
utils.recalc.callrate(),
utils.recalc.freqhets(),
utils.recalc.freqhomref(),
utils.recalc.freqhomsnp(),
utils.recalc.maf(),
utils.reset.flags(),
utils.transpose(),
utils.vcf.depth(),
utils.vcfr2genlight.polyploid()
Examples
pp <- possums.gl[1:30,1:20]
if (isTRUE(getOption("dartR_fbm"))) pp <- gl.gen2fbm(pp)
gl.Ho(pp)
Adds metadata into a genlight object
Description
This function adds the metadata information to the slot ind.metrics and populates population and coordinates information slots if they are found in the metadata.
Usage
gl.add.indmetrics(x, ind.metafile, verbose = NULL)
Arguments
x |
Name of the genlight object containing the SNP or SilicoDArT data [required]. |
ind.metafile |
path and name of CSV file containing the metadata information for each individual (see details for explanation) [required]. |
verbose |
Verbosity: 0, silent or fatal errors; 1, begin and end; 2, progress log; 3, progress and results summary; 5, full report [default NULL, adopting the global verbosity set by gl.set.verbosity(), or 2 if no global is set]. |
Details
The ind.metadata file needs to have very specific headings. First a column
with a heading named 'id'. Here the ids must match the ids in the genlight
object, e.g. indNames(your_genlight). The following column headings
are optional:
'pop' - specifies the population membership of each individual.
'lat' - latitude coordinates (in decimal degrees WGS1984 format).
'lon' - longitude coordinates (in decimal degrees WGS1984 format).
Additional columns with individual metadata can be imported (e.g. age, sex, etc).
Value
A genlight object with metadata information for each individual.
Author(s)
Author(s): Luis Mijangos. Custodian: Luis Mijangos – Post to https://groups.google.com/d/forum/dartr
See Also
Other data manipulation:
gl.define.pop(),
gl.drop.ind(),
gl.drop.loc(),
gl.drop.pop(),
gl.edit.recode.pop(),
gl.fbm.cleanup(),
gl.fbm2gen(),
gl.gen2fbm(),
gl.impute(),
gl.join(),
gl.keep.ind(),
gl.keep.loc(),
gl.keep.pop(),
gl.make.recode.ind(),
gl.make.recode.pop(),
gl.merge.pop(),
gl.reassign.ind(),
gl.reassign.pop(),
gl.recode.ind(),
gl.recode.pop(),
gl.rename.pop(),
gl.sample(),
gl.sim.genotypes(),
gl.sort(),
gl.subsample.ind(),
gl.subsample.loc(),
gl.subsample.loci()
Examples
dartfile <- system.file('extdata','testset_SNPs_2Row.csv', package='dartR.data')
metadata <- system.file('extdata','testset_metadata.csv', package='dartR.data')
gl <- gl.read.dart(dartfile, probar=FALSE)
#test fbm
if (isTRUE(getOption("dartR_fbm"))) gl <- gl.gen2fbm(gl)
gl <- gl.add.indmetrics(gl, ind.metafile = metadata)
Calculates the frequency of the reference and alternate allele for each locus
Description
Calculates the frequency of the reference allele (alf1) and the alternate allele (alf2) at each locus, pooled across all individuals in the genlight object.
Usage
gl.alf(x, verbose = NULL)
Arguments
x |
Name of the genlight object [required]. |
verbose |
Verbosity: 0, silent or fatal errors; 1, begin and end; 2, progress log; 3, progress and results summary; 5, full report [default NULL, adopting the global verbosity set by gl.set.verbosity(), or 2 if no global is set]. |
Details
This is a lightweight accessor: it returns the per-locus frequencies directly (visibly) and does not modify the input. Apart from the datatype check (which honours the resolved verbosity, so it is silent at verbose = 0), it produces no console output. The alternate allele frequency is the mean genotype score at the locus divided by 2, computed with na.rm = TRUE, and alf1 is its complement, so the two columns sum to 1 at every locus with at least one scored genotype. A locus with no scored genotypes returns NaN in both columns.
The frequencies are unrounded, and they are computed in a single pass over
the genotype matrix without splitting the object by population, which
makes this the fast path used inside loops and by utils.recalc.maf.
gl.allele.freq with simple = TRUE returns the same
quantity rounded to 4 decimal places, and additionally offers the
per-population and population x locus aggregations that gl.alf does not.
Row names are the locus names, in locus order. Duplicate locus names are
disambiguated with make.unique() so that the row keys always
correspond positionally to the loci of the input.
The function applies to SNP genotype data only. Tag presence/absence (SilicoDArT) data has ploidy 1 and no alternate allele, so it is rejected rather than divided by the SNP ploidy.
Value
A data.frame with one row per locus, in locus order, and two columns: alf1, the frequency of the reference allele, and alf2, the frequency of the alternate allele. Loci with all genotypes missing return NaN in both columns.
Author(s)
Author(s): Bernd Gruber. Custodian: Bernd Gruber – Post to https://groups.google.com/d/forum/dartr
See Also
Other utilities:
gl.He(),
gl.Ho(),
utils.allelic.richness(),
utils.basic.stats(),
utils.check.datatype(),
utils.collapse.matrix(),
utils.dart2genlight(),
utils.dist.binary(),
utils.fbm.amat(),
utils.fbm.blocks(),
utils.fbm.colblocks(),
utils.fbm.colwise(),
utils.fbm.copy(),
utils.fbm.count.mean(),
utils.fbm.decode(),
utils.fbm.grm(),
utils.fbm.has(),
utils.fbm.new(),
utils.fbm.pair.counts(),
utils.fbm.reader(),
utils.fbm.rowwise(),
utils.fbm.tempfile(),
utils.flag.start(),
utils.het.pop(),
utils.history.call(),
utils.is.fixed(),
utils.jackknife(),
utils.n.var.invariant(),
utils.plot.save(),
utils.read.fasta(),
utils.read.ped(),
utils.recalc.avgpic(),
utils.recalc.callrate(),
utils.recalc.freqhets(),
utils.recalc.freqhomref(),
utils.recalc.freqhomsnp(),
utils.recalc.maf(),
utils.reset.flags(),
utils.transpose(),
utils.vcf.depth(),
utils.vcfr2genlight.polyploid()
Examples
#test fbm
if (isTRUE(getOption("dartR_fbm"))) possums.gl <- gl.gen2fbm(possums.gl)
#for the first 10 loci only
gl.alf(possums.gl[,1:10])
barplot(t(as.matrix(gl.alf(possums.gl[,1:10]))))
gl.allele.freq(possums.gl[,1:10],simple=TRUE)
barplot(t(as.matrix(gl.allele.freq(possums.gl[,1:10],simple=TRUE))))
Generates percentage allele frequencies by locus and population
Description
This is a support script, to take SNP data or SilicoDArT presence/absence data grouped into populations in a genlight object {adegenet} and generate a table of allele frequencies for each population and locus
Usage
gl.allele.freq(x, percent = FALSE, by = "pop", simple = FALSE, verbose = NULL)
Arguments
x |
Name of the genlight object containing the SNP or Tag P/A (SilicoDArT) data [required]. |
percent |
If TRUE, percentage allele frequencies are given, if FALSE allele proportions are given [default FALSE] |
by |
If by='popxloc' then breakdown is given by population and locus; if by='pop' then breakdown is given by population with statistics averaged across loci; if by='loc' then breakdown is given by locus, with the frequency computed across all individuals and the other statistics (nobs, nmissing, n) averaged across populations [default 'pop'] |
simple |
A legacy option to return a dataframe with the frequency of the reference allele (alf1) and the frequency of the alternate allele (alf2) by locus; overrides percent and by (sets by='loc' and percent=FALSE) [default FALSE] |
verbose |
Verbosity: 0, silent or fatal errors; 1, begin and end; 2, progress log; 3, progress and results summary; 5, full report [default 2 or as specified using gl.set.verbosity] |
Value
A data.frame with allele (SNP data) or presence/absence frequencies (Tag P/A data) broken down by population and locus
Author(s)
Author(s): Arthur Georges. Custodian: Arthur Georges (Post to https://groups.google.com/d/forum/dartr)
See Also
Other unmatched report:
gl.report.allelerich(),
gl.report.basics(),
gl.report.diversity(),
gl.report.polyploid_heterozygosity(),
gl.report.shannon()
Examples
#test fbm
if (isTRUE(getOption("dartR_fbm"))) testset.gl <- gl.gen2fbm(testset.gl)
gl.allele.freq(testset.gl,percent=FALSE,by='pop')
gl.allele.freq(testset.gl,percent=FALSE,by="loc")
gl.allele.freq(testset.gl,percent=FALSE,by="popxloc")
gl.allele.freq(testset.gl,simple=TRUE)
Returns the verbosity level a function should use
Description
Resolves the verbosity level for a dartR function. Most dartR functions
call it first, as verbose <- gl.check.verbosity(verbose).
Usage
gl.check.verbosity(x = NULL)
Arguments
x |
User requested level of verbosity, a single number from 0 to 5, or NULL to use the global default [default NULL]. |
Details
The verbosity comes from one of three sources, in this order of precedence:
the value passed by the user in the function's
verboseargument;the global default set with
gl.set.verbosity, stored as the R optiondartR_verbose;the value 2, when neither of the above is set.
A valid value is a single number from 0 to 5. Any other value (out of
range, non-numeric, NA, or a vector of length other than one),
whether passed as x or found in the global option, prints a
warning and is replaced by 2.
Value
The verbosity level to use, a single number from 0 to 5.
Author(s)
Author(s): Bernd Gruber. Custodian: Bernd Gruber (Post to https://groups.google.com/d/forum/dartr)
See Also
Other environment:
gl.check.wd(),
gl.print.history(),
gl.recalc.metrics(),
gl.set.verbosity(),
gl.set.wd(),
theme_dartR()
Examples
gl.check.verbosity()
gl.check.verbosity(3)
Checks the global working directory
Description
The working directory can be set in one of two ways – (a) explicitly by the user by passing a value using the parameter plot.dir in a function, or (b) by setting the working directory globally as part of the r environment (gl.set.wd). In accordance with CRAN policy, the default is tempdir().
Usage
gl.check.wd(wd = NULL, verbose = NULL)
Arguments
wd |
path to the working directory [default NULL; resolves to the dartR_wd option if set with gl.set.wd(), otherwise to tempdir()]. |
verbose |
Verbosity: 0, silent or fatal errors; 1, begin and end; 2, progress log; 3, progress and results summary; 5, full report [default NULL, adopting the global verbosity set by gl.set.verbosity(), or 2 if no global is set]. |
Value
the working directory
Author(s)
Author(s): Bernd Gruber. Custodian: Bernd Gruber (Post to https://groups.google.com/d/forum/dartr)
See Also
Other environment:
gl.check.verbosity(),
gl.print.history(),
gl.recalc.metrics(),
gl.set.verbosity(),
gl.set.wd(),
theme_dartR()
Examples
gl.check.wd()
Returns a list of colors for use in plots
Description
Creates a vector of colors in hex (e.g. "#3B9AB2" "#78B7C5") based on user selected category (parameter type).
"2" [two colors]
"2c" [two colors contrast]
"3" [three colors]
"4" [four colors]
"structure" [35 discrete colors, suitable for structure-style plots]
"div", "dis", "con", "vir" [color palettes, see details]
Usage
gl.colors(type = 2, verbose = NULL)
Arguments
type |
Type of color (2, 3 or 4 colors, "structure", or a palette type, see description) [default 2]. |
verbose |
Verbosity: 0, silent or fatal errors; 1, begin and end; 2, progress log; 3, progress and results summary; 5, full report [default 2 or as specified using gl.set.verbosity]. |
Details
A palette of colors can be specified via "div" [divergent], "dis" [discrete], "con" [convergent], "vir" [viridis]. Be aware a palette needs the number of colors specified as well. It returns a function and therefore the number of colors needs to be a part of the function call. Check the examples to see how this works.
Value
A vector of colors in hex format, or, for the palette types ("div", "dis", "con", "vir"), a function taking the number of colors as its argument.
Author(s)
Author(s): Bernd Gruber. Custodian: Bernd Gruber – Post to https://groups.google.com/d/forum/dartr
See Also
Other graphics:
gl.map.interactive(),
gl.plot.heatmap(),
gl.plot.snp.density(),
gl.select.colors(),
gl.select.shapes(),
gl.smearplot(),
gl.tree.nj()
Examples
gl.colors(2)
gl.colors("2")
gl.colors("2c")
#five discrete colors
gl.colors(type="dis")(5)
#seven divergent colors
gl.colors("div")(7)
Checks a genlight object to see if it complies with dartR expectations and amends it to comply if necessary @family environment
Description
This function will check to see that the genlight object conforms to expectation in regard to dartR requirements (see details), and if it does not, will rectify it.
Usage
gl.compliance.check(x, verbose = NULL)
Arguments
x |
Name of the input genlight object [required]. |
verbose |
Verbosity: 0, silent or fatal errors; 1, begin and end; 2, progress log ; 3, progress and results summary; 5, full report [default 2 or as specified using gl.set.verbosity]. |
Details
A genlight object used by dartR has a number of requirements that allow functions within the package to operate correctly. The genlight object comprises:
The SNP genotypes or Tag Presence/Absence data (SilicoDArT);
An associated dataframe (gl@other$loc.metrics) containing the locus metrics (e.g. Call Rate, Repeatability, etc);
An associated dataframe (gl@other$ind.metrics) containing the individual/sample metrics (e.g. sex, latitude (=lat), longitude(=lon), etc);
A specimen identity field (indNames(gl)) with the unique labels applied to each individual/sample;
A population assignment (popNames) for each individual/specimen;
Flags that indicate whether or not calculable locus metrics have been updated.
Value
A genlight object that conforms to the expectations of dartR
Author(s)
Author(s): Luis Mijangos. Custodian: Luis Mijangos – Post to https://groups.google.com/d/forum/dartr
Examples
x <- gl.compliance.check(testset.gl)
x <- gl.compliance.check(testset.gs)
Defines a new population in a genlight object for specified individuals
Description
The script reassigns existing individuals to a new population and removes their existing population assignment. The script returns a genlight object with the new population assignment.
Usage
gl.define.pop(x, ind.list, new, verbose = NULL)
Arguments
x |
Name of the genlight object containing SNP genotypes [required]. |
ind.list |
A list of individuals to be assigned to the new population [required]. |
new |
Name of the new population [required]. |
verbose |
Verbosity: 0, silent or fatal errors; 1, begin and end; 2, progress log; 3, progress and results summary; 5, full report [default 2 or as specified using gl.set.verbosity]. |
Value
A genlight object with the redefined population structure.
Author(s)
Author(s): Arthur Georges. Custodian: Arthur Georges – Post to https://groups.google.com/d/forum/dartr
See Also
Other data manipulation:
gl.add.indmetrics(),
gl.drop.ind(),
gl.drop.loc(),
gl.drop.pop(),
gl.edit.recode.pop(),
gl.fbm.cleanup(),
gl.fbm2gen(),
gl.gen2fbm(),
gl.impute(),
gl.join(),
gl.keep.ind(),
gl.keep.loc(),
gl.keep.pop(),
gl.make.recode.ind(),
gl.make.recode.pop(),
gl.merge.pop(),
gl.reassign.ind(),
gl.reassign.pop(),
gl.recode.ind(),
gl.recode.pop(),
gl.rename.pop(),
gl.sample(),
gl.sim.genotypes(),
gl.sort(),
gl.subsample.ind(),
gl.subsample.loc(),
gl.subsample.loci()
Examples
if (isTRUE(getOption("dartR_fbm"))) testset.gl <- gl.gen2fbm(testset.gl)
popNames(testset.gl)
gl <- gl.define.pop(testset.gl, ind.list=c('AA019073','AA004859'),
new='newguys')
popNames(gl)
indNames(gl)[pop(gl)=='newguys']
Provides descriptive stats and plots to diagnose potential problems with Hardy-Weinberg proportions
Description
Different causes may be responsible for lack of Hardy-Weinberg proportions. This function helps diagnose potential problems.
Usage
gl.diagnostics.hwe(
  x,
  alpha_val = 0.05,
  bins = 20,
  stdErr = TRUE,
  colors.hist = gl.colors(2, verbose = 0),
  colors.barplot = gl.colors("2c", verbose = 0),
  plot.theme = theme_dartR(),
  n.cores = "auto",
  plot.file = NULL,
  plot.dir = NULL,
  verbose = NULL
)
Arguments
x |
Name of the genlight object containing the SNP data [required]. |
alpha_val |
Level of significance for testing [default 0.05]. |
bins |
Number of bins to display in histograms [default 20]. |
stdErr |
Whether standard errors for Fis and Fst should be computed (default: TRUE) |
colors.hist |
List of two color names for the borders and fill of the histogram [default gl.colors(2, verbose = 0)]. |
colors.barplot |
Vector with two color names for the observed and expected number of significant HWE tests [default gl.colors("2c", verbose = 0)]. |
plot.theme |
User specified theme [default theme_dartR()]. |
n.cores |
Kept for backward compatibility and ignored: the jackknife is computed directly from the per-locus statistics and needs no parallel processing [default "auto"]. |
plot.file |
Name for the RDS binary file to save (base name only, exclude extension) [default NULL] |
plot.dir |
Directory in which to save files [default = working directory] |
verbose |
Verbosity: 0, silent or fatal errors; 1, begin and end; 2, progress log ; 3, progress and results summary; 5, full report [default NULL, adopting the global verbosity set by gl.set.verbosity(), or 2 if no global is set]. |
Details
This function initially runs gl.report.hwe and reports
the ternary plots. The remaining outputs follow the recommendations from
Waples
(2015) paper and De Meeus 2018. These include:
A histogram with the distribution of p-values of the HWE tests. The distribution should be roughly uniform across equal-sized bins.
A bar plot with observed and expected (null expectation) number of loci significant in 0, 1, ..., n populations. The y axis is the number of loci; the expectation is the number of loci times the binomial probability of that many significant tests at
alpha_val. If HWE tests are significant by chance alone, observed and expected number of HWE tests should have roughly a similar distribution.A scatter plot with a linear regression between Fst and Fis, averaged across subpopulations. De Meeus 2018 suggests that in the case of Null alleles, a strong positive relationship is expected (together with the Fis standard error much larger than the Fst standard error, see below). Note, this is not the scatter plot that Waples 2015 presents in his paper. In the lower right corner of the plot, the Pearson correlation coefficient is reported.
The Fis and Fst (averaged over loci and subpopulations) standard errors are also printed on screen and reported in the returned list (if
stdErr=TRUE). These are computed with the Jackknife method over loci (See De Meeus 2007 for details on how this is computed). De Meeus 2018 suggests that under a global significant heterozygosity deficit:- if the correlation between Fis and Fst is strongly positive, and StdErrFis >> StdErrFst, Null alleles are likely to be the cause.
- if the correlation between Fis and Fst is ~0 or mildly positive, and StdErrFis > StdErrFst, Wahlund may be the cause.
- if the correlation between Fis and Fst is ~0, and StdErrFis ~ StdErrFst, selfing or sib mating could to be the cause.
It is important to realise that these statistics only suggest a pattern (pointers). Their absence is not conclusive evidence of the absence of the problem, as their presence does not confirm the cause of the problem.
A table where the number of observed and expected significant HWE tests are reported by each population, indicating whether these are due to heterozygosity excess or deficiency. These can be used to have a clue of potential problems (e.g. deficiency might be due to a Wahlund effect, presence of null alleles or non-random sampling; excess might be due to sex linkage or different selection between sexes, demographic changes or small Ne. See Table 1 in Wapples 2015). The last two columns of the table generated by this function report chisquare values and their associated p-values. Chisquare is computed following Fisher's procedure for a global test (Fisher 1970), with twice as many degrees of freedom as HWE tests were run in the population; loci monomorphic or under-sampled in a population are not tested there, and the expected number of significant tests is
alpha_valtimes the number of tests. This basically tests whether there is at least one test that is truly significant in the series of tests conducted (De Meeus et al 2009).
Value
A list with the table with the summary of the HWE tests and (if stdErr=TRUE) a named vector with the StdErrFis and StdErrFst.
Author(s)
Author(s): Carlo Pacioni. Custodian: Carlo Pacioni – Post to https://groups.google.com/d/forum/dartr
References
de Meeus, T., McCoy, K.D., Prugnolle, F., Chevillon, C., Durand, P., Hurtrez-Bousses, S., Renaud, F., 2007. Population genetics and molecular epidemiology or how to "debusquer la bete". Infection, Genetics and Evolution 7, 308-332.
De Meeus, T., Guegan, J.-F., Teriokhin, A.T., 2009. MultiTest V.1.2, a program to binomially combine independent tests and performance comparison with other related methods on proportional data. BMC Bioinformatics 10, 443-443.
De Meeus, T., 2018. Revisiting FIS, FST, Wahlund Effects, and Null Alleles. Journal of Heredity 109, 446-456.
Fisher, R., 1970. Statistical methods for research workers Edinburgh: Oliver and Boyd.
-
Waples, R. S. (2015). Testing for Hardy-Weinberg proportions: have we lost the plot?. Journal of heredity, 106(1), 1-19.
See Also
Examples
require("dartR.data")
if (isTRUE(getOption("dartR_fbm"))) platypus.gl <- gl.gen2fbm(platypus.gl)
gl <- gl.filter.allna(platypus.gl[,1:50])
res <- gl.diagnostics.hwe(x = gl ,  stdErr=FALSE, n.cores=1)
Calculates a distance matrix for individuals defined in a genlight object
Description
Calculates various distances between individuals based on allele frequencies or presence-absence data
Usage
gl.dist.ind(
  x,
  method = NULL,
  scale = FALSE,
  swap = FALSE,
  type = "dist",
  plot.display = TRUE,
  plot.theme = theme_dartR(),
  plot.colors = NULL,
  plot.file = NULL,
  plot.dir = NULL,
  verbose = NULL
)
Arguments
x |
Name of the genlight [required]. |
method |
Specify distance measure [SNP: Euclidean; P/A: Simple]. |
scale |
If TRUE and method='euclidean', the Euclidean distances are scaled to fall in the range [0,1]; scale is ignored for the other methods [default FALSE] |
swap |
If TRUE and working with presence-absence data, then presence (no disrupting mutation) is scored as 0 and absence (presence of a disrupting mutation) is scored as 1 [default FALSE]. |
type |
Specify the type of output, "dist" or "matrix" [default "dist"] |
plot.display |
If TRUE, resultant plots are displayed in the plot window [default TRUE]. |
plot.theme |
Theme for the plot. See Details for options [default theme_dartR()]. |
plot.colors |
List of two color names for the borders and fill of the plots [default c("#2171B5","#6BAED6")]. |
plot.file |
Name for the RDS binary file to save (base name only, exclude extension) [default NULL] |
plot.dir |
Directory to save the plot RDS files [default as specified by the global working directory or tempdir()] |
verbose |
Verbosity: 0, silent or fatal errors; 1, begin and end; 2, progress log ; 3, progress and results summary; 5, full report [default 2 or as specified using gl.set.verbosity]. |
Details
The distance measure for SNP genotypes can be one of:
Euclidean Distance [method = "Euclidean"]
Scaled Euclidean Distance [method="Euclidean", scale=TRUE]
Simple Mismatch Distance [method="Simple"]
Absolute Mismatch Distance [method="Absolute"]
Czekanowski (Manhattan) Distance [method="Manhattan"]
The distance measure for Sequence Tag Presence/Absence data (binary) can be one of:
Euclidean Distance [method = "Euclidean"]
Scaled Euclidean Distance [method = "Euclidean", scale = TRUE]
Simple Matching Distance [method = "Simple"]
Jaccard Distance [method = "Jaccard"]
Bray-Curtis Distance [method = "Bray-Curtis"]
Sorensen Distance [method = "Sorensen"] (identical by formula to Bray-Curtis for binary data)
Jaccard, Bray-Curtis and Sorensen are defined for presence/absence data only; requesting them for SNP data stops with an error.
For a file-backed (FBM) object the pairwise counts behind every SNP distance are added over blocks of loci read from the backing file, so the genotype matrix is never decoded as a whole; the distances are identical to those of the same data held in memory. The distance matrix itself (8 bytes per pair of individuals) is held in memory. Refer to the documentation of functions in https://doi.org/10.1101/2023.03.22.533737 for algorithms and definitions.
Value
An object of class 'matrix' or dist' giving distances between individuals
Author(s)
Author(s): Arthur Georges. Custodian: Arthur Georges – Post to https://groups.google.com/d/forum/dartr
See Also
Other distance:
gl.dist.pop(),
gl.fst.pop(),
gl.propShared(),
utils.dist.ind.snp()
Examples
if (isTRUE(getOption("dartR_fbm"))) testset.gl <- gl.gen2fbm(testset.gl)
D <- gl.dist.ind(testset.gl[1:20,1:100], method='manhattan')
D <- gl.dist.ind(testset.gs[1:20,1:100], method='Jaccard',swap=TRUE)
D <- gl.dist.ind(testset.gl[1:20,1:100], method='euclidean',scale=TRUE)
Generates a distance matrix from a SNP genlight object taking into account a substitution model
Description
Generates a distance matrix for individuals or populations in a genlight object using one of a selection of substitution models.
Usage
gl.dist.phylo(
  x,
  subst.model = "F81",
  min.tag.len = NULL,
  pairwise.missing = TRUE,
  by.pop = TRUE,
  gamma = FALSE,
  variance = FALSE,
  verbose = NULL
)
Arguments
x |
Name of the genlight object containing the SNP data [required]. |
subst.model |
The evolutionary model of nucleotide substitutions to employ in calculating genetic distance between individuals [default "F81"]. |
min.tag.len |
Minimum tag length of sequence tags to be used in the analysis [default NULL]. |
pairwise.missing |
Whether to delete the sites with missing data in a pairwise way [default TRUE]. Not supported by ape for subst.model = 'BH87': forced to FALSE (global deletion) with a warning, because ape::dist.dna crashes the R session for that combination. |
by.pop |
If TRUE, the distance matrix is based on comparing populations; if FALSE, on individuals [default TRUE]. |
gamma |
Gamma correction for inter-site variation in substitution rates, passed to ape::dist.dna(): FALSE for no correction, or a positive value giving the shape parameter (alpha) of the gamma distribution, for the substitution models that support it [default FALSE]. |
variance |
If TRUE, ape::dist.dna() attaches the variances of the individual-level distances as attribute 'variance'; the attribute is not preserved by population averaging when by.pop = TRUE [default FALSE]. |
verbose |
Verbosity: 0, silent or fatal errors; 1, begin and end; 2, progress log; 3, progress and results summary; 5, full report [default NULL, adopting the global verbosity set by gl.set.verbosity(), or 2 if no global is set]. |
Details
The script takes a genlight object as input, creates a set of sequences from the trimmed sequence tags for each individual, calculates distances between the individuals and then optionally averages those distances between the populations defined in the genlight object (typically OTUs).
The input genlight object must carry the locus metrics 'TrimmedSequence' and 'SnpPosition' in the @other$loc.metrics slot, and the allele pairs (e.g. 'G/A') in the @loc.all slot. Objects read from DArT reports have these; genlight objects from other sources (for example, from a VCF file) may not, in which case this function cannot be used. Note also that secondaries (multiple SNPs on one sequence tag) each contribute a full duplicate copy of the tag to the assembled sequences, with only their own SNP substituted; consider gl.filter.secondaries() before calling this function.
Heterozygous genotypes are written into the assembled sequences as IUPAC ambiguity codes, and ape::dist.dna() treats ambiguity codes as missing data. Heterozygous sites therefore carry no distance signal – distances are driven by homozygous differences only, and are biased downward wherever heterozygosity is appreciable. With pairwise.missing = FALSE the effect is global: any site at which any individual is heterozygous (or missing) is deleted for all individuals, which can remove most or all of the variable sites. A warning reporting the fraction of heterozygous genotype calls is printed at verbose 1 or above.
min.tag.len : Sequence tags can vary considerably in length, which results in large numbers of Ns in alignments. This can have an impact of distance measures depending on how missing values are managed. To minimize this effect, you might elect to filter on tag length using this parameter.
subst.model : Use this parameter to specify the substitution model, selecting from the list used by package ape.
-
raw: This is simply the proportion or the number of sites that differ between each pair of sequences. This may be useful to draw "saturation plots". The options variance and gamma have no effect, but pairwise.missing can.
-
TS, TV: These are the numbers of transitions and transversions, respectively.
-
JC69: This model was developed by Jukes and Cantor (1969). It assumes that all substitutions (i.e. a change of a base by another one) have the same probability. This probability is the same for all sites along the DNA sequence. This last assumption can be relaxed by assuming that the substition rate varies among site following a gamma distribution whose shape parameter is supplied via the gamma argument. By default (gamma = FALSE), no gamma correction is applied. Another assumption is that the base frequencies are balanced and thus equal to 0.25.
-
K80: The distance derived by Kimura (1980), sometimes referred to as "Kimura's 2-parameters distance", has the same underlying assumptions than the Jukes-Cantor distance except that two kinds of substitutions are considered: transitions (A <-> G, C <-> T), and transversions (A <-> C, A <-> T, C <-> G, G <-> T). They are assumed to have different probabilities. A transition is the substitution of a purine (C, T) by another one, or the substitution of a pyrimidine (A, G) by another one. A transversion is the substitution of a purine by a pyrimidine, or vice-versa. Both transition and transversion rates are the same for all sites along the DNA sequence. Jin and Nei (1990) modified the Kimura model to allow for variation among sites following a gamma distribution. Like for the Jukes-Cantor model, the gamma shape parameter is supplied via the gamma argument. By default, no gamma correction is applied.
-
F81: Felsenstein (1981) generalized the Jukes-Cantor model by relaxing the assumption of equal base frequencies. The formulae used in this function were taken from McGuire et al. (1999).
-
K81: Kimura (1981) generalized his model (Kimura 1980) by assuming different rates for two kinds of transversions: A <-> C and G <-> T on one side, and A <-> T and C <-> G on the other. This is what Kimura called his "three substitution types model" (3ST), and is sometimes referred to as "Kimura's 3-parameters distance".
-
F84: This model generalizes K80 by relaxing the assumption of equal base frequencies. It was first introduced by Felsenstein in 1984 in Phylip, and is fully described by Felsenstein and Churchill (1996). The formulae used in this function were taken from McGuire et al. (1999).
-
BH87: Barry and Hartigan (1987) developed a distance based on the observed proportions of changes among the four bases. This distance is not symmetric. With by.pop = FALSE the result is returned as ape's full asymmetric matrix, not a dist object; with by.pop = TRUE the population averaging uses the block of distances from the individuals of the row population to those of the column population and assigns the mean to both triangles, silently symmetrising the result.
-
T92: Tamura (1992) generalized the Kimura model by relaxing the assumption of equal base frequencies. This is done by taking into account the bias in G+C content in the sequences. The substitution rates are assumed to be the same for all sites along the DNA sequence.
-
TN93: Tamura and Nei (1993) developed a model which assumes distinct rates for both kinds of transition (A <-> G versus C <-> T), and transversions. The base frequencies are not assumed to be equal and are estimated from the data. A gamma correction of the inter-site variation in substitution rates is possible, supplied via the gamma argument.
-
GG95: Galtier and Gouy (1995) introduced a model where the G+C content may change through time. Different rates are assumed for transitons and transversions.
-
logdet: The Log-Det distance, developed by Lockhart et al. (1994), is related to BH87. However, this distance is symmetric. Formulae from Gu and Li (1996) are used. dist.logdet in phangorn uses a different implementation that gives substantially different distances for low-diverging sequences.
-
paralin: Lake (1994) developed the paralinear distance which can be viewed as another variant of the Barry-Hartigan distance.
pairwise.missing : If TRUE, then missing values in the sequence (Ns and ambiguity codes) will be accommodated in the calculations pair of taxa at a time; otherwise, the deletion of data at positions in the sequence will be global (deleted if any missing data at the position in any individual).
Value
The distance matrix as an object of class dist. With by.pop = TRUE, labels are popNames(x). With by.pop = FALSE, labels are composites of the individual and population names in the form indName_pop (e.g. 'T27_TENTERFIELD'), taken from the FASTA headers written by gl2fasta(), not indNames(x). Exception: with subst.model = "BH87" and by.pop = FALSE, the return is ape's full asymmetric matrix (class matrix), not a dist object.
Author(s)
Author(s): Arthur Georges. Custodian: Arthur Georges – Post to https://groups.google.com/d/forum/dartr
See Also
Other phylogeny:
gl.tree.fitch()
Examples
if (isTRUE(getOption("dartR_fbm"))) platypus.gl <- gl.gen2fbm(platypus.gl)
tmp <- gl.filter.monomorphs(platypus.gl, verbose = 0)
gl.dist.phylo(x=tmp,subst.model="F81")
Calculates a distance matrix for populations with SNP or Silicodart genotypes in a genlight object
Description
This script calculates various distances between populations based on allele frequencies (SNP genotypes) or frequency of presences in PA (SilicoDArT) data
Usage
gl.dist.pop(
  x,
  as.pop = NULL,
  method = "euclidean",
  scale = FALSE,
  type = "dist",
  plot.display = TRUE,
  plot.theme = theme_dartR(),
  plot.colors = NULL,
  plot.file = NULL,
  plot.dir = NULL,
  verbose = NULL
)
Arguments
x |
Name of the genlight object [required]. |
as.pop |
Temporarily assign another locus metric as the population for the purposes of deletions [default NULL]. |
method |
Specify distance measure [default euclidean]. |
scale |
If TRUE and method='euclidean', the distance will be scaled: for SilicoDArT data the scaled distance falls in the range [0,1]; for SNP data the attainable maximum is 0.5 (see Details) [default FALSE]. |
type |
Specify the type of output, dist or matrix [default 'dist'] |
plot.display |
If TRUE, resultant plots are displayed in the plot window [default TRUE]. |
plot.theme |
Theme for the plot. See Details for options [default theme_dartR()]. |
plot.colors |
List of two color names for the borders and fill of the plots [default c("#2171B5","#6BAED6")]. |
plot.file |
Name for the RDS binary file to save (base name only, exclude extension) [default NULL] |
plot.dir |
Directory to save the plot RDS files [default as specified by the global working directory or tempdir()] |
verbose |
Verbosity: 0, silent or fatal errors; 1, begin and end; 2, progress log ; 3, progress and results summary; 5, full report [default 2 or as specified using gl.set.verbosity]. |
Details
For SNP data, the distance measure can be one of 'euclidean', 'nei', 'reynolds', 'chord' or 'fixed-diff'. For SilicoDArT data, the distance measure can be one of 'euclidean', 'simple', 'jaccard' or 'sorensen'.
Two of the SNP measures are variants of their textbook forms. The 'reynolds' distance is the linearised (divergence-time) variant -log(1 - D) of the Reynolds, Weir and Cockerham (1983) coancestry distance D. The 'chord' distance is the Cavalli-Sforza and Edwards (1967) chord distance scaled by the constant 2*sqrt(2)/pi.
With scale=TRUE and method='euclidean', the scaled distance falls in the range [0,1] for SilicoDArT data; for SNP data the attainable maximum is 0.5 (two populations fixed for opposite alleles at every locus), a consequence of the 0.5 scaling factor applied to the SNP form.
The euclidean distance for SilicoDArT data is computed from the population frequencies of tag presence; it is a different statistic from a between-individual euclidean distance averaged over population pairs ('simple', 'jaccard' and 'sorensen' are computed the latter way, via gl.dist.ind).
Refer to the documentation of functions in https://doi.org/10.1101/2023.03.22.533737 for algorithms and definitions.
Value
An object of class 'dist' giving distances between populations
Author(s)
Author(s): Arthur Georges. Custodian: Arthur Georges – Post to https://groups.google.com/d/forum/dartr
See Also
Other distance:
gl.dist.ind(),
gl.fst.pop(),
gl.propShared(),
utils.dist.ind.snp()
Examples
# SNP genotypes
if (isTRUE(getOption("dartR_fbm"))) possums.gl <- gl.gen2fbm(possums.gl)
D <- gl.dist.pop(possums.gl, method='euclidean')
D <- gl.dist.pop(possums.gl, method='euclidean',scale=TRUE)
D <- gl.dist.pop(possums.gl, method='nei')
D <- gl.dist.pop(possums.gl, method='reynolds')
D <- gl.dist.pop(possums.gl, method='chord')
D <- gl.dist.pop(possums.gl, method='fixed-diff')
#Presence-Absence data [only 10 individuals due to speed]
D <- gl.dist.pop(testset.gs[1:10,], method='euclidean')
Removes specified individuals from a dartR genlight object
Description
This function deletes individuals and their associated metadata. Monomorphic loci and loci that are scored all NA are optionally deleted (mono.rm=TRUE). The script also optionally recalculates locus metatdata statistics to accommodate the deletion of individuals from the dataset (recalc=TRUE).
The script returns a dartR genlight object with the retained individuals and the recalculated locus metadata. The script works with both genlight objects containing SNP genotypes and Tag P/A data (SilicoDArT).
Usage
gl.drop.ind(x, ind.list, recalc = FALSE, mono.rm = FALSE, verbose = NULL)
Arguments
x |
Name of the genlight object [required]. |
ind.list |
List of individuals to be removed [required]. |
recalc |
If TRUE, recalculate the locus metadata statistics [default FALSE]. |
mono.rm |
If TRUE, remove monomorphic and all NA loci [default FALSE]. |
verbose |
Verbosity: 0, silent or fatal errors; 1, begin and end; 2, progress but not results; 3, progress and results summary; 5, full report [default 2 or as specified using gl.set.verbosity]. |
Value
A reduced dartR genlight object
Author(s)
Author(s): Arthur Georges. Custodian: Arthur Georges – Post to https://groups.google.com/d/forum/dartr
See Also
gl.keep.ind to keep rather than drop specified
individuals
Other data manipulation:
gl.add.indmetrics(),
gl.define.pop(),
gl.drop.loc(),
gl.drop.pop(),
gl.edit.recode.pop(),
gl.fbm.cleanup(),
gl.fbm2gen(),
gl.gen2fbm(),
gl.impute(),
gl.join(),
gl.keep.ind(),
gl.keep.loc(),
gl.keep.pop(),
gl.make.recode.ind(),
gl.make.recode.pop(),
gl.merge.pop(),
gl.reassign.ind(),
gl.reassign.pop(),
gl.recode.ind(),
gl.recode.pop(),
gl.rename.pop(),
gl.sample(),
gl.sim.genotypes(),
gl.sort(),
gl.subsample.ind(),
gl.subsample.loc(),
gl.subsample.loci()
Examples
 # SNP data
 if (isTRUE(getOption("dartR_fbm"))) testset.gl <- gl.gen2fbm(testset.gl)
   gl2 <- gl.drop.ind(testset.gl,
   ind.list=c('AA019073','AA004859'))
 # Tag P/A data
   gs2 <- gl.drop.ind(testset.gs,
   ind.list=c('AA020656','AA19077','AA004859'))
   gs2 <- gl.drop.ind(testset.gs, ind.list=c('AA020656'
   ,'AA19077','AA004859'),mono.rm=TRUE, recalc=TRUE)
Removes specified loci from a dartR genlight object
Description
This function deletes specified loci and their associated metadata. The script returns a dartR genlight object with the retained loci. The script works with both genlight objects containing SNP genotypes and Tag P/A data (SilicoDArT).
Usage
gl.drop.loc(x, loc.list = NULL, first = NULL, last = NULL, verbose = NULL)
Arguments
x |
Name of the genlight object [required]. |
loc.list |
A list of loci to be deleted [required, if loc.range not specified]. |
first |
First of a range of loci to be deleted [required, if loc.list not specified]. |
last |
Last of a range of loci to be deleted [if not specified, last locus in the dataset]. |
verbose |
Verbosity: 0, silent or fatal errors; 1, begin and end; 2, progress but not results; 3, progress and results summary; 5, full report [default 2 or as specified using gl.set.verbosity]. |
Value
A reduced dartR genlight object
Author(s)
Author(s): Arthur Georges. Custodian: Arthur Georges – Post to https://groups.google.com/d/forum/dartr
See Also
gl.keep.loc to keep rather than drop specified loci
Other data manipulation:
gl.add.indmetrics(),
gl.define.pop(),
gl.drop.ind(),
gl.drop.pop(),
gl.edit.recode.pop(),
gl.fbm.cleanup(),
gl.fbm2gen(),
gl.gen2fbm(),
gl.impute(),
gl.join(),
gl.keep.ind(),
gl.keep.loc(),
gl.keep.pop(),
gl.make.recode.ind(),
gl.make.recode.pop(),
gl.merge.pop(),
gl.reassign.ind(),
gl.reassign.pop(),
gl.recode.ind(),
gl.recode.pop(),
gl.rename.pop(),
gl.sample(),
gl.sim.genotypes(),
gl.sort(),
gl.subsample.ind(),
gl.subsample.loc(),
gl.subsample.loci()
Examples
# SNP data
if (isTRUE(getOption("dartR_fbm"))) testset.gl <- gl.gen2fbm(testset.gl)
  gl2 <- gl.drop.loc(testset.gl, loc.list=c('100051468|42-A/T', '100049816-51-A/G'),verbose=3)
# Tag P/A data
  gs2 <- gl.drop.loc(testset.gs, loc.list=c('20134188','19249144'),verbose=3)
Removes specified populations from a dartR genlight object
Description
Individuals are assigned to populations based on associated specimen metadata stored in the dartR genlight object. This function deletes all individuals in the nominated populations (pop.list). Monomorphic loci and loci that are scored all NA are optionally deleted (mono.rm=TRUE). The script also optionally recalculates locus metatdata statistics to accommodate the deletion of individuals from the dataset (recalc=TRUE). The script returns a dartR genlight object with the retained populations and the recalculated locus metadata. The script works with both genlight objects containing SNP genotypes and Tag P/A data (SilicoDArT).
Usage
gl.drop.pop(
  x,
  pop.list,
  as.pop = NULL,
  recalc = FALSE,
  mono.rm = FALSE,
  verbose = NULL
)
Arguments
x |
Name of the genlight object [required]. |
pop.list |
List of populations to be removed [required]. |
as.pop |
Temporarily assign another locus metric as the population for the purposes of deletions [default NULL]. |
recalc |
If TRUE, recalculate the locus metadata statistics [default FALSE]. |
mono.rm |
If TRUE, remove monomorphic and all NA loci [default FALSE]. |
verbose |
Verbosity: 0, silent or fatal errors; 1, begin and end; 2, progress but not results; 3, progress and results summary; 5, full report [default 2 or as specified using gl.set.verbosity]. |
Value
A reduced dartR genlight object
Author(s)
Author(s): Arthur Georges. Custodian: Arthur Georges – Post to https://groups.google.com/d/forum/dartr
See Also
gl.keep.pop to keep rather than drop specified populations
Other data manipulation:
gl.add.indmetrics(),
gl.define.pop(),
gl.drop.ind(),
gl.drop.loc(),
gl.edit.recode.pop(),
gl.fbm.cleanup(),
gl.fbm2gen(),
gl.gen2fbm(),
gl.impute(),
gl.join(),
gl.keep.ind(),
gl.keep.loc(),
gl.keep.pop(),
gl.make.recode.ind(),
gl.make.recode.pop(),
gl.merge.pop(),
gl.reassign.ind(),
gl.reassign.pop(),
gl.recode.ind(),
gl.recode.pop(),
gl.rename.pop(),
gl.sample(),
gl.sim.genotypes(),
gl.sort(),
gl.subsample.ind(),
gl.subsample.loc(),
gl.subsample.loci()
Examples
 # SNP data
 if (isTRUE(getOption("dartR_fbm"))) testset.gl <- gl.gen2fbm(testset.gl)
   gl2 <- gl.drop.pop(testset.gl,
   pop.list=c('EmsubRopeMata','EmvicVictJasp'),verbose=3)
   gl2 <- gl.drop.pop(testset.gl, pop.list=c('EmsubRopeMata','EmvicVictJasp'),
   mono.rm=TRUE,recalc=TRUE)
   gl2 <- gl.drop.pop(testset.gl,as.pop='sex',pop.list=c('Male','Unknown'),verbose=3)
 # Tag P/A data
   gs2 <- gl.drop.pop(testset.gs, pop.list=c('EmsubRopeMata','EmvicVictJasp'))
Creates or edits individual (=specimen) names, creates a recode_ind file and applies the changes to a genlight object @family data manipulation
Description
A function to edit names of individual in a dartR genlight object, or to create a reassignment table taking the individual labels from a genlight object, or to edit existing individual labels in an existing recode_ind file. The amended recode table is then applied to the genlight object.
Usage
gl.edit.recode.ind(
  x,
  out.recode.file = NULL,
  outpath = NULL,
  recalc = FALSE,
  mono.rm = FALSE,
  verbose = NULL
)
Arguments
x |
Name of the genlight object [required]. |
out.recode.file |
Name of the file to output the new individual labels [optional]. |
outpath |
Directory to save the recode table [default as specified by the global working directory or tempdir()] |
recalc |
If TRUE, recalculate the locus metadata statistics [default FALSE]. |
mono.rm |
If TRUE, remove monomorphic loci [default FALSE]. |
verbose |
Verbosity: 0, silent or fatal errors; 1, begin and end; 2, progress log; 3, progress and results summary; 5, full report [default NULL, adopting the global verbosity set by gl.set.verbosity(), or 2 if no global is set]. |
Details
Renaming individuals may be required when there have been errors in labeling
arising in the passage of samples to sequencing. There may be occasions
where renaming individuals is required for preparation of figures.
This function will input an existing recode table for editing and optionally
save it as a new table, or if the name of an input table is not supplied,
will generate a table using the individual labels in the parent genlight
object.
When caution needs to be exercised because of the potential for breaking the
'chain of evidence' associated with the samples, recoding individuals using
a recode table (csv) can provide a durable record of the changes.
Having deleted individuals, the function optionally identifies resultant
monomorphic loci or loci with all values missing and deletes them
(mono.rm), and optionally recalculates the locus metadata as
appropriate (recalc). Both are FALSE by default, so after recoding
the locus metrics are flagged as no longer current (they may be
recalculated later with gl.recalc.metrics).
Use outpath=getwd() when calling this function to direct
output files to your working directory.
The function returns a dartR genlight object with the new population assignments
and the recalculated locus metadata.
Value
An object of class ('genlight') with the revised individual labels.
Author(s)
Author(s): Arthur Georges. Custodian: Arthur Georges – Post to https://groups.google.com/d/forum/dartr
See Also
gl.recode.ind, gl.drop.ind,
gl.keep.ind
Examples
#this is an interactive example
if(interactive()){
if (isTRUE(getOption("dartR_fbm"))) testset.gl <- gl.gen2fbm(testset.gl)
gl <- gl.edit.recode.ind(testset.gl)
gl <- gl.edit.recode.ind(testset.gl, out.recode.file='ind.recode.table.csv')
}
Creates or edits and applies a population re-assignment table
Description
A function to edit population assignments in a dartR genlight object, or to create a reassignment table taking the population assignments from a genlight object, or to edit existing population assignments in a pop.recode.table. The amended recode table is then applied to the genlight object.
Usage
gl.edit.recode.pop(
  x,
  pop.recode = NULL,
  out.recode.file = NULL,
  outpath = NULL,
  recalc = FALSE,
  mono.rm = FALSE,
  verbose = NULL
)
Arguments
x |
Name of the genlight object [required]. |
pop.recode |
Path to an existing recode table (csv) to load as the starting point for editing. If NULL, a table is generated from the population assignments in x [default NULL]. |
out.recode.file |
Name of the file to save the edited population recode table to (written under outpath) [default NULL]. |
outpath |
Directory to save the recode table [default as specified by the global working directory or tempdir()] |
recalc |
If TRUE, recalculate the locus metadata statistics [default FALSE]. |
mono.rm |
If TRUE, remove monomorphic loci [default FALSE]. |
verbose |
Verbosity: 0, silent or fatal errors; 1, begin and end; 2, progress log; 3, progress and results summary; 5, full report [default NULL, adopting the global verbosity set by gl.set.verbosity(), or 2 if no global is set]. |
Details
Genlight objects assign specimens to populations based on information in the ind.metadata file provided when the genlight object is first generated. Often one wishes to subset the data by deleting populations or to amalgamate populations. This can be done with a pop.recode table with two columns. The first column is the population assignment in the genlight object, the second column provides the new assignment. This function will input an existing reassignment table for editing and optionally save it as a new table, or if the name of an input table is not supplied, will generate a table using the population assignments in the parent genlight object. It will then apply the recodings to the genlight object. When caution needs to be exercised because of the potential for breaking the 'chain of evidence' associated with the samples, recoding individuals using a recode table (csv) can provide a durable record of the changes. For SNP genotype data, the function, having deleted populations, optionally identifies resultant monomorphic loci or loci with all values missing and deletes them. The script also optionally recalculates the locus metadata as appropriate. The optional deletion of monomorphic loci and the optional recalculation of locus statistics is not available for Tag P/A data (SilicoDArT). Use outpath=getwd() when calling this function to direct output files to your working directory. The function returns a dartR genlight object with the new population assignments and the recalculated locus metadata.
Value
A genlight object with the revised population assignments
Author(s)
Author(s): Arthur Georges. Custodian: Arthur Georges – Post to https://groups.google.com/d/forum/dartr
See Also
gl.recode.pop, gl.drop.pop,
gl.keep.pop, gl.merge.pop,
gl.reassign.pop
Other data manipulation:
gl.add.indmetrics(),
gl.define.pop(),
gl.drop.ind(),
gl.drop.loc(),
gl.drop.pop(),
gl.fbm.cleanup(),
gl.fbm2gen(),
gl.gen2fbm(),
gl.impute(),
gl.join(),
gl.keep.ind(),
gl.keep.loc(),
gl.keep.pop(),
gl.make.recode.ind(),
gl.make.recode.pop(),
gl.merge.pop(),
gl.reassign.ind(),
gl.reassign.pop(),
gl.recode.ind(),
gl.recode.pop(),
gl.rename.pop(),
gl.sample(),
gl.sim.genotypes(),
gl.sort(),
gl.subsample.ind(),
gl.subsample.loc(),
gl.subsample.loci()
Examples
#this is an interactive example
if(interactive()){
if (isTRUE(getOption("dartR_fbm"))) testset.gl <- gl.gen2fbm(testset.gl)
gl <- gl.edit.recode.pop(testset.gl)
gs <- gl.edit.recode.pop(testset.gs)
}

# See also -------------------
Removes backing files of file-backed objects that are no longer used
Description
File-backed (FBM) dartR objects (see gl.gen2fbm) keep their
genotypes in a backing file (.bk). Every subset, filter or imputation of a
file-backed object writes a new backing file. dartR deletes a backing file
automatically once no object in the R session uses it any more, when R's
garbage collector removes the last such object.
gl.fbm.cleanup() forces that step: it runs the garbage collector,
deletes the backing files that are no longer used, and reports what is
left. Use it in long sessions, or before checking the free disk space.
Usage
gl.fbm.cleanup(verbose = NULL)
Arguments
verbose |
Verbosity: 0, silent or fatal errors; 1, begin and end; 2, progress log; 3, progress and results summary; 5, full report [default NULL, adopting the global verbosity set by gl.set.verbosity(), or 2 if no global is set]. |
Details
Only backing files created by dartR in the current session are ever
deleted. A backing file named by the user (argument backingfile of
gl.gen2fbm, cbind or rbind) is never deleted.
On Windows a backing file cannot be deleted while it is still memory-mapped, which it can be for a short while after its last object is removed. Such files are deleted at the next attempt (by this function, or when dartR creates the next backing file).
Backing files are placed in getOption("FBM.dir"), by default the
session temporary folder, which R deletes at the end of the session. If
FBM.dir is set to another folder, files that could not be deleted
when R closed can remain there; they can be deleted by hand once no R
session uses them.
A file stays while anything in the session still refers to its object.
ggplot2 keeps the last plot drawn (for ggsave() and
last_plot()), and that plot refers to the input object of the dartR
function that drew it, so one earlier backing file can stay in use until
the next plot is drawn.
Objects saved with saveRDS() and loaded again with
readRDS() in the same session are not known to dartR: their backing
file can be deleted when the original object is removed. Use
gl.save and gl.load instead.
Value
Invisibly, a list with the number and size (Mb) of the backing
files deleted (deleted, deleted.mb), still in use
(in.use, in.use.mb) and still waiting to be deleted
(pending).
Author(s)
Author(s): Bernd Gruber. Custodian: Bernd Gruber – Post to https://groups.google.com/d/forum/dartr
See Also
Other data manipulation:
gl.add.indmetrics(),
gl.define.pop(),
gl.drop.ind(),
gl.drop.loc(),
gl.drop.pop(),
gl.edit.recode.pop(),
gl.fbm2gen(),
gl.gen2fbm(),
gl.impute(),
gl.join(),
gl.keep.ind(),
gl.keep.loc(),
gl.keep.pop(),
gl.make.recode.ind(),
gl.make.recode.pop(),
gl.merge.pop(),
gl.reassign.ind(),
gl.reassign.pop(),
gl.recode.ind(),
gl.recode.pop(),
gl.rename.pop(),
gl.sample(),
gl.sim.genotypes(),
gl.sort(),
gl.subsample.ind(),
gl.subsample.loc(),
gl.subsample.loci()
Examples
x <- gl.gen2fbm(testset.gl)
for (i in 1:5) x <- x[-1, ]   # each subset writes a new backing file
gl.fbm.cleanup()
Converts a file-backed (FBM) genlight object to a gen-backed one
Description
'gl.fbm2gen()' converts a 'dartR' whose genotypes live in the '@fbm' slot into a 'dartR' with genotypes in the '@gen' (list of SNPbin) slot. At the end, '@fbm' is set to 'NULL' and '@gen' holds the SNPbin list.
The conversion reads the FBM in **blocks of loci** (the order in which the
backing file is stored, so reading is fast) and packs each block directly
into the bits of the SNPbin objects; the full genotype matrix is never
decoded at once. The block size follows the bigstatsr option
bigstatsr.block.sizeGB (default 1): a block holds one sixteenth of
bigstatsr::block_size(nInd(x)) loci (at least 512). Beyond the
result itself, the conversion needs a few hundred Mb with the default
(about 370 Mb for 2,000 individuals x 200,000 loci); lower the option to
convert with less memory.
Genotypes must be 0, 1, 2 or missing (0 or 1 for haploid individuals); other values give an error.
Usage
gl.fbm2gen(x, chunk = NULL, quiet = TRUE, verbose = NULL)
Arguments
x |
A 'dartR' or 'genlight' object. If it holds no FBM, it is returned unchanged. |
chunk |
Deprecated and ignored: the blocks are now blocks of loci
whose size follows |
quiet |
Logical; if 'TRUE', suppress the non-critical "no FBM found" message regardless of verbosity [default TRUE]. |
verbose |
Verbosity: 0, silent or fatal errors; 1, begin and end; 2, progress log; 3, progress and results summary; 5, full report [default NULL, adopting the global verbosity set by gl.set.verbosity(), or 2 if no global is set]. |
Value
A 'dartR' object with **'@gen' populated** and **'@fbm = NULL'**.
Author(s)
Author(s): Luis Mijangos. Custodian: Luis Mijangos – Post to https://groups.google.com/d/forum/dartr
See Also
Other data manipulation:
gl.add.indmetrics(),
gl.define.pop(),
gl.drop.ind(),
gl.drop.loc(),
gl.drop.pop(),
gl.edit.recode.pop(),
gl.fbm.cleanup(),
gl.gen2fbm(),
gl.impute(),
gl.join(),
gl.keep.ind(),
gl.keep.loc(),
gl.keep.pop(),
gl.make.recode.ind(),
gl.make.recode.pop(),
gl.merge.pop(),
gl.reassign.ind(),
gl.reassign.pop(),
gl.recode.ind(),
gl.recode.pop(),
gl.rename.pop(),
gl.sample(),
gl.sim.genotypes(),
gl.sort(),
gl.subsample.ind(),
gl.subsample.loc(),
gl.subsample.loci()
Examples
x <- gl.gen2fbm(testset.gl)
y <- gl.fbm2gen(x)
length(y@gen)      # one SNPbin per individual
identical(as.matrix(y), as.matrix(testset.gl))
Estimates the rate of false positives in a fixed difference analysis
Description
Estimates how many fixed differences between two populations would arise from sampling error alone, given the observed allele frequencies and sample sizes, and the probability that false positives alone reach the observed count of fixed differences.
Usage
gl.fdsim(
  x,
  poppair,
  obs = NULL,
  sympatric = FALSE,
  reps = 1000,
  delta = 0.02,
  verbose = NULL
)
Arguments
x |
Name of the genlight object containing the SNP or SilicoDArT genotypes [required]. |
poppair |
Labels of two different populations for comparison, in the form c(popA, popB) [required]. |
obs |
Observed number of fixed differences between the two populations. If NULL, it is calculated with gl.fixed.diff [default NULL]. |
sympatric |
If TRUE, the two populations are sympatric; if FALSE, allopatric [default FALSE]. |
reps |
Number of replicates in the simulation, a whole number of at least 2 [default 1000]. |
delta |
The threshold value for the minor allele frequency to regard the difference between two populations as fixed [default 0.02]. |
verbose |
Verbosity: 0, silent or fatal errors; 1, begin and end; 2, progress log; 3, progress and results summary; 5, full report [default 2, unless specified using gl.set.verbosity]. |
Details
Loci that are missing in either population are dropped, as are loci
that already show a true fixed difference: minor allele frequency below
delta in one population and above 1 - delta in the other.
Each remaining locus can produce a false positive.
In each of reps replicates, a true allele frequency is drawn for
each population and locus by binomial sampling around the observed
frequency. From it, the probability that samples of the observed size
show a fixed difference is computed, and a false positive is drawn with
that probability. The count of false positives across loci is recorded.
For allopatric populations (sympatric = FALSE) each population is
sampled from its own observed frequencies. For sympatric populations
(sympatric = TRUE) both are sampled from the pooled frequency,
weighted by sample size, each with its own sample size: the null
hypothesis that both samples come from one gene pool.
Sample sizes are counted in alleles (twice the number of individuals) for SNP data, and in individuals for SilicoDArT data.
The p-value is the share of replicates whose count reaches the observed
count, (sum(count >= obs) + 1) / (reps + 1), so the smallest
reportable value is 1 / (reps + 1).
Value
A named list of four numbers:
observed – the observed count of fixed differences;
mnexpected – the mean simulated count of false positives;
sdexpected – the standard deviation of the simulated count of false positives;
prob – the probability that false positives alone reach the observed count.
Author(s)
Author(s): Arthur Georges. Custodian: Arthur Georges (Post to https://groups.google.com/d/forum/dartr)
See Also
Other fixed difference analysis:
gl.fixed.diff()
Examples
if (isTRUE(getOption("dartR_fbm"))) testset.gl <- gl.gen2fbm(testset.gl)
fd <- gl.fdsim(testset.gl[, 1:100],
  poppair = c("EmsubRopeMata", "EmmacBurnBara"),
  reps = 100, verbose = 3
)
Filters loci with all NA across individuals and/or individuals with all NA across loci
Description
This script deletes loci or individuals with all calls missing (NA), from a genlight object.
Usage
gl.filter.allna(x, by.pop = FALSE, recalc = FALSE, verbose = NULL)
Arguments
x |
Name of the input genlight object [required]. |
by.pop |
If TRUE, loci that are all missing in any one population are deleted [default FALSE] |
recalc |
Recalculate the locus metadata statistics if any individuals are deleted in the filtering [default FALSE]. |
verbose |
Verbosity: 0, silent or fatal errors; 1, begin and end; 2, progress log; 3, progress and results summary; 5, full report [default 2, unless specified using gl.set.verbosity]. |
Details
A DArT dataset will not have loci for which the calls are scored all as missing (NA) for a particular individual, but such loci can arise rarely when populations or individuals are deleted. Similarly, a DArT dataset will not have individuals for which the calls are scored all as missing (NA) across all loci, but such individuals may sneak in to the dataset when loci are deleted. Retaining individual or loci with all NAs can cause issues for several functions.
Also, on occasions an analysis will require that there are some loci scored in each population. Setting by.pop=TRUE will result in removal of loci when they are all missing in any one population.
Note that loci that are missing for all individuals in a population are
not imputed with method 'frequency' or 'HW'. Consider
using the function gl.filter.allna with by.pop=TRUE.
Value
A genlight object having removed individuals that are scored NA across all loci, or loci that are scored NA across all individuals.
Author(s)
Author(s): Arthur Georges. Custodian: Arthur Georges – Post to https://groups.google.com/d/forum/dartr
See Also
Other matched filter:
gl.filter.callrate(),
gl.filter.contamination(),
gl.filter.excess.het(),
gl.filter.factorloadings(),
gl.filter.hamming(),
gl.filter.heterozygosity(),
gl.filter.hwe(),
gl.filter.ld(),
gl.filter.locmetric(),
gl.filter.maf(),
gl.filter.monomorphs(),
gl.filter.overshoot(),
gl.filter.pa(),
gl.filter.rdepth(),
gl.filter.replicates(),
gl.filter.replicates.KING(),
gl.filter.reproducibility(),
gl.filter.secondaries(),
gl.filter.taglength()
Examples
# SNP data
if (isTRUE(getOption("dartR_fbm"))) testset.gl <- gl.gen2fbm(testset.gl)
  result <- gl.filter.allna(testset.gl, verbose=3)
# Tag P/A data
  result <- gl.filter.allna(testset.gs, verbose=3)
Filters loci or specimens in a genlight {adegenet} object based on call rate
Description
SNP datasets generated by DArT have missing values primarily arising from failure to call a SNP because of a mutation at one or both of the restriction enzyme recognition sites. The script gl.filter.callrate() will filter out the loci with call rates below a specified threshold.
Tag Presence/Absence datasets (SilicoDArT) have missing values where it is not possible to determine reliably if there the sequence tag can be called at a particular locus.
Usage
gl.filter.callrate(
  x,
  method = "loc",
  threshold = 0.95,
  mono.rm = FALSE,
  recalc = FALSE,
  recursive = FALSE,
  plot.display = TRUE,
  plot.theme = theme_dartR(),
  plot.colors = NULL,
  plot.file = NULL,
  plot.dir = NULL,
  bins = 25,
  verbose = NULL
)
Arguments
x |
Name of the genlight object containing the SNP or presence/absence (SilicoDArT) data [required]. |
method |
Use method='loc' to specify that loci are to be filtered, 'ind' to specify that specimens are to be filtered, 'pop' to remove loci that fail to meet the specified threshold in any one population [default 'loc']. |
threshold |
Threshold value below which loci will be removed [default 0.95]. |
mono.rm |
Remove monomorphic loci after analysis is complete [default FALSE]. |
recalc |
Recalculate the locus metadata statistics if any individuals are deleted in the filtering [default FALSE]. |
recursive |
Repeatedly filter individuals on call rate, each time removing monomorphic loci. Only applies if method='ind' and mono.rm=TRUE [default FALSE]. |
plot.display |
If TRUE, histograms are displayed in the plot window [default TRUE]. |
plot.theme |
Theme for the plot. See Details for options [default theme_dartR()]. |
plot.colors |
Vector with two color names for the borders and fill [default c("#2171B5", "#6BAED6")]. |
plot.file |
Name for the RDS binary file to save (base name only, exclude extension) [default NULL] |
plot.dir |
Directory in which to save files [default = working directory] |
bins |
Number of bins to display in histograms [default 25]. |
verbose |
Verbosity: 0, silent or fatal errors; 1, begin and end; 2, progress log ; 3, progress and results summary; 5, full report [default 2, unless specified using gl.set.verbosity]. |
Details
Because this filter operates on call rate, this function recalculates Call Rate, if necessary, before filtering. If individuals are removed using method='ind', then the call rate stored in the genlight object is, optionally, recalculated after filtering.
Note that when filtering individuals on call rate, the initial call rate is calculated and compared against the threshold. After filtering, if mono.rm=TRUE, the removal of monomorphic loci will alter the call rates. Some individuals with a call rate initially greater than the nominated threshold, and so retained, may come to have a call rate lower than the threshold. If this is a problem, repeated iterations of this function will resolve the issue. This is done by setting mono.rm=TRUE and recursive=TRUE, or it can be done manually.
Callrate is summarized by locus or by individual to allow sensible decisions on thresholds for filtering taking into consideration consequential loss of data. The summary is in the form of a tabulation and plots.
Plot themes can be obtained from
If a plot.file is given, the ggplot arising from this function is saved as an "RDS" binary file using saveRDS(); can be reloaded with readRDS(). A file name must be specified for the plot to be saved. If a plot directory (plot.dir) is specified, the ggplot binary is saved to that directory; otherwise to the tempdir().
Value
The reduced genlight object
Author(s)
Author(s): Arthur Georges. Custodian: Arthur Georges – Post to https://groups.google.com/d/forum/dartr
See Also
Other matched filter:
gl.filter.allna(),
gl.filter.contamination(),
gl.filter.excess.het(),
gl.filter.factorloadings(),
gl.filter.hamming(),
gl.filter.heterozygosity(),
gl.filter.hwe(),
gl.filter.ld(),
gl.filter.locmetric(),
gl.filter.maf(),
gl.filter.monomorphs(),
gl.filter.overshoot(),
gl.filter.pa(),
gl.filter.rdepth(),
gl.filter.replicates(),
gl.filter.replicates.KING(),
gl.filter.reproducibility(),
gl.filter.secondaries(),
gl.filter.taglength()
Examples
# SNP data
if (isTRUE(getOption("dartR_fbm"))) testset.gl <- gl.gen2fbm(testset.gl)
  result <- gl.filter.callrate(testset.gl[1:10], method='loc', threshold=0.8,
   verbose=3)
  result <- gl.filter.callrate(testset.gl[1:10], method='ind', threshold=0.8,
   verbose=3)
  result <- gl.filter.callrate(testset.gl[1:10], method='pop', threshold=0.8,
   verbose=3)
# Tag P/A data
  result <- gl.filter.callrate(testset.gs[1:10], method='loc',
  threshold=0.95, verbose=3)
  result <- gl.filter.callrate(testset.gs[1:10], method='ind',
  threshold=0.8, verbose=3)
  result <- gl.filter.callrate(testset.gs[1:10], method='pop',
  threshold=0.8, verbose=3)

  res <- gl.filter.callrate(platypus.gl)
Removes individuals flagged as cross-contaminated samples
Description
Runs the contamination screen of gl.report.contamination
and removes the individuals it flags. Use the report first to check the
candidate list and tune the thresholds; the filter takes the same
parameters.
Usage
gl.filter.contamination(
  x,
  flag = c("suspect", "adjacent", "mixed"),
  rare.freq = 0.02,
  min.n = 5,
  z.flag = 3,
  min.excess = 0.02,
  rare.min.excess = 0.005,
  min.share = 20,
  share.tol = 0.05,
  depth.ratio = 1.5,
  depth.flat = 1.25,
  min.reads = 20,
  balance.cut = 0.25,
  min.calls = 1000,
  plate = NULL,
  recalc = FALSE,
  mono.rm = FALSE,
  verbose = NULL
)
Arguments
x |
Name of the genlight object containing the SNP data [required]. |
flag |
Classes of individual to remove, any of "suspect", "adjacent", "mixed" and "rare-only" [default c("suspect", "adjacent", "mixed")]. |
rare.freq |
Allele frequency in the rest of the population below which an allele counts as rare; must lie in (0, 0.5) [default 0.02]. |
min.n |
Minimum number of other individuals in the population called at a locus for that locus to enter the rare-allele burden; at least 2 [default 5]. |
z.flag |
Robust z-score above which a statistic is an outlier [default 3]. |
min.excess |
Absolute amount by which heterozygosity must also exceed the population median to be flagged [default 0.02]. |
rare.min.excess |
The same absolute margin for the rare-allele burden [default 0.005]. |
min.share |
Minimum number of rare-allele loci an individual needs before its source is chosen by allele sharing rather than by residual kinship alone [default 20]. |
share.tol |
Sharing scores within this distance of the best are treated as ties and separated by residual kinship [default 0.05]. |
depth.ratio |
Foreign-allele rate in the deepest quartile of loci over the shallowest, at or above which the depth pattern is "dose" [default 1.5]. |
depth.flat |
The same ratio below which the pattern is "flat" [default 1.25]. |
min.reads |
Minimum number of reads (REF plus ALT) for a genotype to enter the read-balance test [default 20]. |
balance.cut |
Share of the reads below which the minority allele of a heterozygous call marks it as skewed; must lie in (0, 0.5] [default 0.25]. |
min.calls |
Minimum number of genotypes with at least
|
plate |
Data frame with columns id, plate and well giving the plate
position of each individual; when NULL, positions are taken from
|
recalc |
Recalculate the locus metadata statistics if any individuals are deleted [default FALSE]. |
mono.rm |
Remove monomorphic loci after individuals are deleted [default FALSE]. |
verbose |
Verbosity: 0, silent or fatal errors; 1, begin and end; 2, progress log; 3, progress and results summary; 5, full report [default NULL, adopting the global verbosity set by gl.set.verbosity(), or 2 if no global is set]. |
Details
The screen is described in gl.report.contamination. In
brief, an individual is a "suspect" when its heterozygosity is a robust
outlier within its population and exceeds the population median by
more than min.excess; a suspect whose strongest residual-kinship
partner sits in an adjacent plate well is "adjacent"; an individual whose
rare-allele burden is elevated but whose heterozygosity is normal is
"rare-only", which points to population structure or mislabelling rather
than contamination; an individual whose read balance marks it as a
mixture of two animals is "mixed" (this needs the read counts kept by
gl.read.vcf(read.counts = TRUE)).
flag names the classes to remove. The default removes "suspect",
"adjacent" and "mixed": the two classes with the heterozygosity signal
that contamination always produces, and the class with direct read
evidence of a mixture, which also covers contamination from the same
population. Add "rare-only" to also remove individuals
that carry an excess of alleles rare in their assigned population, or set
flag = "adjacent" to remove only the suspects with plate evidence.
The tier 3 depth pattern (dose, flat, saturated, unclear) is
printed for each removed individual but does not change the flag or the
filter: a "flat" pattern points to a hybrid, admixed or mislabelled
animal rather than a contaminant, so review such cases before removing
them, for example by dropping them from the screen with
gl.keep.ind or adding them back afterwards.
The screen is a candidate list, not a verdict: a population whose members differ widely in heterozygosity (inbreeding, admixture, relatives) can yield suspects that are not contaminated. Check the report before filtering.
Removing individuals invalidates the locus metrics that depend on the
composition of individuals (CallRate, allele frequencies, PIC values and
the like). When individuals are removed the corresponding locus-metric
flags are reset so that downstream functions know to recalculate them,
or the metrics are recalculated immediately with recalc = TRUE.
Value
The genlight object with the flagged individuals removed.
Author(s)
Author(s): Luis Mijangos. Custodian: Luis Mijangos – Post to https://groups.google.com/d/forum/dartr
See Also
gl.report.contamination,
gl.filter.heterozygosity
Other matched filter:
gl.filter.allna(),
gl.filter.callrate(),
gl.filter.excess.het(),
gl.filter.factorloadings(),
gl.filter.hamming(),
gl.filter.heterozygosity(),
gl.filter.hwe(),
gl.filter.ld(),
gl.filter.locmetric(),
gl.filter.maf(),
gl.filter.monomorphs(),
gl.filter.overshoot(),
gl.filter.pa(),
gl.filter.rdepth(),
gl.filter.replicates(),
gl.filter.replicates.KING(),
gl.filter.reproducibility(),
gl.filter.secondaries(),
gl.filter.taglength()
Examples
if (isTRUE(getOption("dartR_fbm"))) testset.gl <- gl.gen2fbm(testset.gl)
out <- gl.report.contamination(testset.gl, plot.display = FALSE)
gl <- gl.filter.contamination(testset.gl, verbose = 3)
nInd(testset.gl) - nInd(gl)
Filters excessively-heterozygous loci from a genlight object [deprecated]
Description
Deprecated. Use
gl.filter.hwe(direction = 'excess', min.hobs = 0.5,
test.type = 'ChiSquare', mult.comp.adj = TRUE,
mult.comp.adj.method = 'fdr', cc.val = 0)
instead (cc.val = 0.5
for Yates = TRUE); see gl.filter.hwe.
This wrapper reproduces the workflow of Robledo-Ruiz et al. (2023) for removing loci with a significant excess of heterozygotes (candidate sex-linked or paralogous loci) by calling gl.filter.hwe with the equivalent settings, and will be removed in a future release.
Usage
gl.filter.excess.het(
  x,
  Yates = FALSE,
  mono.rm = FALSE,
  recalc = FALSE,
  verbose = NULL
)
Arguments
x |
A genlight object containing the SNP genotypes [required]. |
Yates |
Whether to use Yates's continuity correction [default FALSE]. |
mono.rm |
Remove monomorphic loci after filtering [default FALSE]. |
recalc |
Recalculate the locus metadata statistics after filtering [default FALSE]. |
verbose |
Verbosity: 0, silent or fatal errors; 1, begin and end; 2, progress log ; 3, progress and results summary; 5, full report [default NULL, adopting the global verbosity set by gl.set.verbosity(), or 2 if no global is set]. |
Details
The published workflow is reproduced via gl.filter.hwe(direction = 'excess', min.hobs = 0.5, ...): only loci with observed heterozygosity of at least 0.5 are tested, and the false-discovery-rate adjustment is confined to that screened set, as in the original. Differences from the original implementation: the chi-square test is performed by HardyWeinberg::HWChisq (p-values can differ marginally from the original hand-rolled test), and the per-population genotype counts are computed on the correct individuals (the original subset individuals with a recycled per-population index).
Value
The genlight object with excessively-heterozygous loci removed, returned invisibly.
Author(s)
Author(s): Jesus Castrejon-Figueroa, Diana A Robledo-Ruiz. Custodian: Ching Ching Lau – Post to https://groups.google.com/d/forum/dartr
References
Robledo-Ruiz, D. A., Austin, L., Amos, J. N., Castrejon-Figueroa, J., Harley, D. K., Magrath, M. J., Sunnucks, P. & Pavlova, A. (2023). Easy-to-use R functions to separate reduced-representation genomic datasets into sex-linked and autosomal loci, and conduct sex assignment. Molecular Ecology Resources.
See Also
Other matched filter:
gl.filter.allna(),
gl.filter.callrate(),
gl.filter.contamination(),
gl.filter.factorloadings(),
gl.filter.hamming(),
gl.filter.heterozygosity(),
gl.filter.hwe(),
gl.filter.ld(),
gl.filter.locmetric(),
gl.filter.maf(),
gl.filter.monomorphs(),
gl.filter.overshoot(),
gl.filter.pa(),
gl.filter.rdepth(),
gl.filter.replicates(),
gl.filter.replicates.KING(),
gl.filter.reproducibility(),
gl.filter.secondaries(),
gl.filter.taglength()
Examples
if (isTRUE(getOption("dartR_fbm"))) LBP <- gl.gen2fbm(LBP)
filtered.gl <- gl.filter.excess.het(x = LBP, Yates = TRUE)
Filters loci based on factor loadings for a PCA or PCoA
Description
Extracts the factor loadings from a glPCA object (generated by gl.pcoa) and filters loci based on a user specified threshold for the ABSOLUTE value of the factor loadings.
Usage
gl.filter.factorloadings(
  x,
  pca,
  axis = 1,
  threshold,
  retain = FALSE,
  plot.display = TRUE,
  plot.theme = theme_dartR(),
  plot.colors = NULL,
  plot.file = NULL,
  plot.dir = NULL,
  bins = 25,
  verbose = NULL,
  ...
)
Arguments
x |
Name of the genlight object containing the SNP data or the SilocoDArT data [required]. |
pca |
Name of the glPCA object containing factor loadings [required]. |
axis |
Axis in the ordination used to display the factor loadings [default 1] |
threshold |
Numeric value for the factor loadings. This value is the ABSOLUTE value of the factor loadings [required]. |
retain |
If true, the resultant genlight object holds only the loci that load high on the specified axis; if FALSE, the resultant genlight object has the loci loading high on the specified axis filtered out [default FALSE]. |
plot.display |
If TRUE, resultant plots are displayed in the plot window [default TRUE]. |
plot.theme |
Theme for the plot. See Details for options [default theme_dartR()]. |
plot.colors |
List of two color names for the borders and fill of the plots [default c("#2171B5","#6BAED6")]. |
plot.file |
Name for the RDS binary file to save (base name only, exclude extension) [default NULL] |
plot.dir |
Directory to save the plot RDS files [default as specified by the global working directory or tempdir()] |
bins |
Number of bins to display in histograms [default 25]. |
verbose |
Verbosity: 0, silent or fatal errors; 1, begin and end; 2, progress log; 3, progress and results summary; 5, full report [default NULL, adopting the global verbosity set by gl.set.verbosity(), or 2 if no global is set]. |
... |
Parameters passed to function ggsave, such as width and height, when the ggplot is to be saved. |
Details
The function extracts the factor loadings for a given axis from a PCA object generated by gl.pcoa and then filters loci on the basis of a user specified threshold. The threshold value is decided using gl.report.factorloadings. The function can be used to filter out loci that load high with a particular axis or alternatively if retain=TRUE, to retain loci that load high on a specified axis.
Note that this function also removes monomorphic loci because PCA is performed only on polymorphic loci.
The pca object must have been generated from the same genlight object as is passed to this function; the function stops if the number of loadings does not match the number of polymorphic loci.
A color vector can be obtained with gl.select.colors() and then passed to the function with the plot.colors parameter.
Themes can be obtained from in
If a plot.file is given, the ggplot arising from this function is saved as an "RDS" binary file using saveRDS(); can be reloaded with readRDS(). A file name must be specified for the plot to be saved. If a plot directory (plot.dir) is specified, the ggplot binary is saved to that directory; otherwise to the tempdir().
Value
The filtered genlight object, returned invisibly.
Author(s)
Author(s): Arthur Georges. Custodian: Arthur Georges – Post to https://groups.google.com/d/forum/dartr
See Also
Other matched filter:
gl.filter.allna(),
gl.filter.callrate(),
gl.filter.contamination(),
gl.filter.excess.het(),
gl.filter.hamming(),
gl.filter.heterozygosity(),
gl.filter.hwe(),
gl.filter.ld(),
gl.filter.locmetric(),
gl.filter.maf(),
gl.filter.monomorphs(),
gl.filter.overshoot(),
gl.filter.pa(),
gl.filter.rdepth(),
gl.filter.replicates(),
gl.filter.replicates.KING(),
gl.filter.reproducibility(),
gl.filter.secondaries(),
gl.filter.taglength()
Examples
if (isTRUE(getOption("dartR_fbm"))) testset.gl <- gl.gen2fbm(testset.gl)
pca <- gl.pcoa(testset.gl)
gl.report.factorloadings(pca = pca)
gl2 <- gl.filter.factorloadings(pca=pca,x=testset.gl,threshold=0.2)
Filters loci by trimmed-sequence similarity using Hamming distance
Description
Identifies loci with highly similar (near-duplicate) trimmed tag sequences and
removes redundant loci, preferentially retaining the locus with the better call
rate (fewer missing genotypes). Loci with near-identical tags are likely to be
fragments of the same genomic locus that the calling pipeline has split into
separate loci; retaining both yields pseudo-replicated, non-independent markers.
This function compares locus TrimmedSequence strings after skipping
a user-defined number of bases (the restriction site) and retaining a fixed-length
substring. Loci whose substrings are within threshold mismatches
(Hamming distance) are considered duplicates and one is dropped.
Usage
gl.filter.hamming(x, threshold = 3, rs = 5, min.length = 50, verbose = NULL)
Arguments
x |
Name of the genlight object containing the SNP or SilicoDArT data [required]. |
threshold |
Maximum allowed Hamming distance (number of
mismatching bases) between two trimmed sequences for them to be treated as
duplicates; a whole number >= 0 and smaller than |
rs |
Number of bases to skip from the start of the TrimmedSequence before extracting the comparison substring (i.e. restriction site length) [default 5]. |
min.length |
Length of the substring used for Hamming comparisons. Despite the name, this is an exact length, not a minimum: longer sequences are truncated to it, and only loci producing a substring of exactly this length are compared; others are retained [default 50]. |
verbose |
Verbosity: 0, silent or fatal errors; 1, begin and end; 2, brief progress messages; 3, progress and results summary; 5, full report [default 2, unless specified using gl.set.verbosity]. |
Details
This function finds near-duplicate TrimmedSequences by first taking the same fixed-length piece of sequence from every locus, then cutting that piece into several smaller sections. It relies on a simple fact: if two sequences differ by only a few letters (up to the threshold), then at least one of those sections must be exactly the same in both. So it uses the sections as 'signatures' to quickly shortlist only those loci that share an identical section, instead of comparing every locus to every other one. For each shortlisted pair, it then checks the two sequences letter-by-letter and stops as soon as it can tell they differ by more than the allowed number.
Before comparison, loci are ordered from most to least missing data (worst
to best call rate). When two loci are found to be within threshold
mismatches, the one with more missing genotypes is dropped, so the retained
locus of every duplicate pair is always the one with the better call rate.
Once a locus is dropped it is not used to match others.
Several SNPs called on the same tag (secondaries, sharing a
CloneID) have identical or near-identical TrimmedSequences, so this
filter also removes them, keeping the SNP with the better call rate. Run
after gl.filter.secondaries, it removes only near-duplicates
between different tags; run on its own, part of what it removes are
secondaries.
The function expects locus metrics to include TrimmedSequence in
x@other$loc.metrics.
Only loci whose TrimmedSequence is long enough to yield a substring of
exactly min.length are compared. Loci with shorter sequences are not
compared and are retained.
This function requires the package Rcpp and a working C++ compiler
toolchain (Rtools on Windows, Xcode Command Line Tools on macOS), as the
comparison engine is compiled at run time.
Value
A genlight object with redundant loci removed.
Author(s)
Author(s): Arthur Georges. Custodian: Arthur Georges – Post to https://groups.google.com/d/forum/dartr
See Also
gl.report.hamming to explore the distribution of
sequence divergence before choosing a threshold.
Other matched filter:
gl.filter.allna(),
gl.filter.callrate(),
gl.filter.contamination(),
gl.filter.excess.het(),
gl.filter.factorloadings(),
gl.filter.heterozygosity(),
gl.filter.hwe(),
gl.filter.ld(),
gl.filter.locmetric(),
gl.filter.maf(),
gl.filter.monomorphs(),
gl.filter.overshoot(),
gl.filter.pa(),
gl.filter.rdepth(),
gl.filter.replicates(),
gl.filter.replicates.KING(),
gl.filter.reproducibility(),
gl.filter.secondaries(),
gl.filter.taglength()
Examples
# x must be a genlight with TrimmedSequence in x@other$loc.metrics

if (isTRUE(getOption("dartR_fbm"))) platypus.gl <- gl.gen2fbm(platypus.gl)
x <- platypus.gl
x2 <- gl.filter.hamming(x, threshold = 3, rs = 5, min.length = 50, verbose = 2)
Filters individuals with average heterozygosity greater than a specified upper threshold or less than a specified lower threshold
Description
Calculates the observed heterozygosity for each individual in a genlight object and filters individuals based on specified threshold values. Use gl.report.heterozygosity to determine the appropriate thresholds.
Usage
gl.filter.heterozygosity(x, t.upper = 0.7, t.lower = 0, verbose = NULL)
Arguments
x |
A genlight object containing the SNP genotypes [required]. |
t.upper |
Filter individuals > the threshold [default 0.7]. |
t.lower |
Filter individuals < the threshold [default 0]. |
verbose |
Verbosity: 0, silent or fatal errors; 1, begin and end; 2, progress log; 3, progress and results summary; 5, full report [default NULL, adopting the global verbosity set by gl.set.verbosity(), or 2 if no global is set]. |
Details
Individuals with observed heterozygosity in the interval [t.lower, t.upper] (boundaries included) are retained. Individuals whose heterozygosity cannot be computed (all genotypes missing) are removed, because they cannot be assessed against the thresholds.
Removing individuals invalidates the locus metrics that depend on the composition of individuals (CallRate, allele frequencies, PIC values and the like); when individuals are removed, the corresponding locus-metric flags are reset so that downstream functions know to recalculate them (use gl.recalc.metrics to recalculate immediately).
Value
The filtered genlight object.
Author(s)
Author(s): Luis Mijangos. Custodian: Luis Mijangos – Post to https://groups.google.com/d/forum/dartr
See Also
Other matched filter:
gl.filter.allna(),
gl.filter.callrate(),
gl.filter.contamination(),
gl.filter.excess.het(),
gl.filter.factorloadings(),
gl.filter.hamming(),
gl.filter.hwe(),
gl.filter.ld(),
gl.filter.locmetric(),
gl.filter.maf(),
gl.filter.monomorphs(),
gl.filter.overshoot(),
gl.filter.pa(),
gl.filter.rdepth(),
gl.filter.replicates(),
gl.filter.replicates.KING(),
gl.filter.reproducibility(),
gl.filter.secondaries(),
gl.filter.taglength()
Examples
if (isTRUE(getOption("dartR_fbm"))) testset.gl <- gl.gen2fbm(testset.gl)
 result <- gl.filter.heterozygosity(testset.gl,t.upper=0.06,verbose=3)
 tmp <- gl.report.heterozygosity(result,method='ind')
Filters loci that show significant departure from Hardy-Weinberg Equilibrium
Description
This function filters out loci showing significant departure from H-W proportions based on observed frequencies of reference homozygotes, heterozygotes and alternate homozygotes. Loci are filtered out if they show HWE departure either in any one population (n.pop.threshold =1) or in at least X number of populations (n.pop.threshold > 1).
Usage
gl.filter.hwe(
  x,
  subset = "each",
  n.pop.threshold = 1,
  test.type = "Exact",
  mult.comp.adj = FALSE,
  mult.comp.adj.method = "BY",
  alpha = 0.05,
  pvalue.type = "midp",
  cc.val = 0.5,
  direction = "both",
  min.hobs = 0,
  n.min = 5,
  verbose = NULL
)
Arguments
x |
Name of the genlight object containing the SNP data [required]. |
subset |
Whether to perform H-W tests within each population ("each"), or taking all individuals as one population ("all") (see details) [default 'each']. |
n.pop.threshold |
The minimum number of populations where the same locus has to be out of H-W proportions to be removed [default 1]. |
test.type |
Method for determining statistical significance: 'ChiSquare' or 'Exact' [default 'Exact']. |
mult.comp.adj |
Whether to adjust p-values for multiple comparisons [default FALSE]. |
mult.comp.adj.method |
Method to adjust p-values for multiple comparisons: 'holm', 'hochberg', 'hommel', 'bonferroni', 'BH', 'BY', 'fdr' (see details) [default 'fdr']. |
alpha |
Level of significance for testing [default 0.05]. |
pvalue.type |
Type of p-value to be used in the Exact method. Either 'dost','selome','midp' (see details) [default 'midp']. |
cc.val |
The continuity correction applied to the ChiSquare test [default 0.5]. |
direction |
Restrict filtering to loci departing from Hardy-Weinberg proportions in a particular direction: 'both' (any departure), 'excess' (heterozygote excess, i.e. observed heterozygotes exceed Hardy-Weinberg expectation) or 'deficit' (heterozygote deficit) [default 'both']. |
min.hobs |
Restrict testing to loci with observed heterozygosity greater than or equal to this proportion; 0 disables the screen. The screen is applied before any adjustment for multiple comparisons, so it also confines the adjustment to the screened loci [default 0]. |
n.min |
Minimum number of individuals per population in which perform H-W tests [default 5]. |
verbose |
Verbosity: 0, silent or fatal errors; 1, begin and end; 2, progress log; 3, progress and results summary; 5, full report [default NULL, adopting the global verbosity set by gl.set.verbosity(), or 2 if no global is set]. |
Details
Several factors can cause deviations from Hardy-Weinberg equilibrium including: mutation, finite population size, selection, population structure, age structure, assortative mating, sex linkage, nonrandom sampling and genotyping errors. Refer to Waples (2015). Note that tests for departure from H-W equilibrium are only valid if there is no population substructure (assuming random mating) and have sufficient power only when there is sufficient sample size (n individuals > 15). Populations can be defined in three ways:
Merging all populations in the dataset using subset = 'all'.
Within each population separately using: subset = 'each'.
Within selected populations using for example: subset = c('pop1','pop2').
Two different statistical methods to test for deviations from Hardy Weinberg proportions:
The classical chi-square test (test.type='ChiSquare') based on the function
HWChisqof the R package HardyWeinberg. By default a continuity correction is applied (cc.val=0.5). The continuity correction can be turned off (by specifying cc.val=0), for example when extreme allele frequencies occur continuity correction can lead to excessive Type I error rates.The exact test (test.type='Exact') based on the exact calculations contained in the function
HWExactStatsof the R package HardyWeinberg as described by Wigginton et al. (2005). The exact test is recommended in most cases. Three different methods to estimate p-values (pvalue.type) in the Exact test can be used:'dost' p-value is computed as twice the tail area of a one-sided test.
'selome' p-value is computed as the sum of the probabilities of all samples less or equally likely as the current sample.
'midp', p-value is computed as half the probability of the current sample + the probabilities of all samples that are more extreme.
The standard exact p-value is overly conservative, in particular for small minor allele frequencies. The mid p-value ameliorates this problem by bringing the rejection rate closer to the nominal level, at the price of occasionally exceeding the nominal level (Graffelman & Moreno, 2013).
Correction for multiple tests can be applied using the following methods
based on the function p.adjust:
'holm' is also known as the sequential Bonferroni technique (Rice, 1989). This method has a greater statistical power than the standard Bonferroni test, however this method becomes very stringent when many tests are performed and many real deviations from the null hypothesis can go undetected (Waples, 2015).
'hochberg' based on Hochberg, 1988.
'hommel' based on Hommel, 1988. This method is more powerful than Hochberg's, but the difference is usually small.
'bonferroni' in which p-values are multiplied by the number of tests. This method is very stringent and therefore has reduced power to detect multiple departures from the null hypothesis.
'BH' based on Benjamini & Hochberg, 1995.
'BY' based on Benjamini & Yekutieli, 2001.
The first four methods are designed to give strong control of the family-wise
error rate. The last two methods control the false discovery rate (FDR),
the expected proportion of false discoveries among the rejected hypotheses.
The false discovery rate is a less stringent condition than the family-wise
error rate, so these methods are more powerful than the others, especially
when number of tests is large.
The number of tests on which the adjustment for multiple comparisons is
the number of populations times the number of loci.
Heterozygote excess and deficit
Loci with a significant excess of heterozygotes are candidate sex-linked or
paralogous (collapsed duplicate) loci (Robledo-Ruiz et al., 2023); loci
with a heterozygote deficit can indicate null alleles, inbreeding or
population substructure (Wahlund effect). Setting direction='excess' (or
'deficit') restricts removal to loci whose observed heterozygote count
exceeds (falls below) the Hardy-Weinberg expectation. To reproduce the
workflow of the deprecated gl.filter.excess.het() (Robledo-Ruiz et al.,
2023), use: direction='excess', min.hobs=0.5, test.type='ChiSquare',
mult.comp.adj=TRUE, mult.comp.adj.method='fdr' (cc.val=0.5 corresponds to
Yates=TRUE, cc.val=0 to Yates=FALSE). The min.hobs=0.5 screen — testing
only loci with observed heterozygosity of at least 0.5 — is an integral
part of that published workflow: it targets the strong-excess loci
characteristic of sex linkage and confines the false-discovery-rate
adjustment to the screened set.
From v2.1 gl.filter.hwe takes the argument
n.pop.threshold.
if n.pop.threshold > 1 loci will be removed only if they are
concurrently
significant (after adjustment if applied) out of hwe in >=
n.pop.threshold > 1.
Value
A genlight object with the loci departing significantly from H-W proportions removed.
Author(s)
Author(s): Luis Mijangos. Custodian: Luis Mijangos – Post to https://groups.google.com/d/forum/dartr
References
Benjamini, Y., and Yekutieli, D. (2001). The control of the false discovery rate in multiple testing under dependency. Annals of Statistics, 29, 1165–1188.
Graffelman, J. (2015). Exploring Diallelic Genetic Markers: The Hardy Weinberg Package. Journal of Statistical Software 64:1-23.
Graffelman, J. & Morales-Camarena, J. (2008). Graphical tests for Hardy-Weinberg equilibrium based on the ternary plot. Human Heredity 65:77-84.
Graffelman, J., & Moreno, V. (2013). The mid p-value in exact tests for Hardy-Weinberg equilibrium. Statistical applications in genetics and molecular biology, 12(4), 433-448.
Hochberg, Y. (1988). A sharper Bonferroni procedure for multiple tests of significance. Biometrika, 75, 800–803.
Hommel, G. (1988). A stagewise rejective multiple test procedure based on a modified Bonferroni test. Biometrika, 75, 383–386.
Rice, W. R. (1989). Analyzing tables of statistical tests. Evolution, 43(1), 223-225.
Robledo-Ruiz, D. A., Austin, L., Amos, J. N., Castrejon-Figueroa, J., Harley, D. K., Magrath, M. J., Sunnucks, P. & Pavlova, A. (2023). Easy-to-use R functions to separate reduced-representation genomic datasets into sex-linked and autosomal loci, and conduct sex assignment. Molecular Ecology Resources.
Waples, R. S. (2015). Testing for Hardy–Weinberg proportions: have we lost the plot?. Journal of heredity, 106(1), 1-19.
Wigginton, J.E., Cutler, D.J., & Abecasis, G.R. (2005). A Note on Exact Tests of Hardy-Weinberg Equilibrium. American Journal of Human Genetics 76:887-893.
See Also
Other matched filter:
gl.filter.allna(),
gl.filter.callrate(),
gl.filter.contamination(),
gl.filter.excess.het(),
gl.filter.factorloadings(),
gl.filter.hamming(),
gl.filter.heterozygosity(),
gl.filter.ld(),
gl.filter.locmetric(),
gl.filter.maf(),
gl.filter.monomorphs(),
gl.filter.overshoot(),
gl.filter.pa(),
gl.filter.rdepth(),
gl.filter.replicates(),
gl.filter.replicates.KING(),
gl.filter.reproducibility(),
gl.filter.secondaries(),
gl.filter.taglength()
Examples
if (isTRUE(getOption("dartR_fbm"))) bandicoot.gl <- gl.gen2fbm(bandicoot.gl)
result <- gl.filter.hwe(x = bandicoot.gl)
Filters loci based on linkage disequilibrium (LD)
Description
This function uses the statistic set in the parameter stat.keep from
function gl.report.ld.map to choose the SNP to keep when two
SNPs are in LD. When a SNP is selected to be filtered out in a pairwise
comparison, the function stores its name in a list; a SNP already in the
list is not listed again.
Usage
gl.filter.ld(x, ld.report, threshold = 0.2, pop.limit = NULL, verbose = NULL)
Arguments
x |
Name of the genlight object containing the SNP data [required]. |
ld.report |
Output from function |
threshold |
Threshold value at or above which loci will be removed [default 0.2]. |
pop.limit |
Minimum number of populations in which LD should be more than the threshold for a locus to be filtered out [default half of the populations represented in ld.report, i.e. ceiling(n/2)]. |
verbose |
Verbosity: 0, silent or fatal errors; 1, begin and end; 2, progress log; 3, progress and results summary; 5, full report [default 2, unless specified using gl.set.verbosity]. |
Details
Within each population, the pairs reported by
gl.report.ld.map with ld.stat at or above
threshold are processed in the order they appear in the report. For
each pair, the locus with the lower stat.keep value is marked for
removal. Note that comparisons are strictly pairwise and sequential: a
locus can be marked for removal against a partner that was itself marked
by an earlier comparison. A locus is removed from the dataset when it is
marked in at least pop.limit populations.
Value
The reduced genlight object (returned invisibly).
Author(s)
Author(s): Luis Mijangos. Custodian: Luis Mijangos – Post to https://groups.google.com/d/forum/dartr
See Also
Other matched filter:
gl.filter.allna(),
gl.filter.callrate(),
gl.filter.contamination(),
gl.filter.excess.het(),
gl.filter.factorloadings(),
gl.filter.hamming(),
gl.filter.heterozygosity(),
gl.filter.hwe(),
gl.filter.locmetric(),
gl.filter.maf(),
gl.filter.monomorphs(),
gl.filter.overshoot(),
gl.filter.pa(),
gl.filter.rdepth(),
gl.filter.replicates(),
gl.filter.replicates.KING(),
gl.filter.reproducibility(),
gl.filter.secondaries(),
gl.filter.taglength()
Examples
if (isTRUE(getOption("dartR_fbm"))) platypus.gl <- gl.gen2fbm(platypus.gl)
test <- gl.filter.callrate(platypus.gl, threshold = 1)
test <- gl.filter.monomorphs(test)
res <- gl.report.ld.map(test)
res_2 <- gl.filter.ld(x = test, ld.report = res)
Filters loci on the basis of numeric information stored in other$loc.metrics in a genlight {adegenet} object
Description
This script uses any field with numeric values stored in $other$loc.metrics to filter loci. The loci to keep can be within the upper and lower thresholds ('within') or outside of the upper and lower thresholds ('outside').
Usage
gl.filter.locmetric(x, metric, upper, lower, keep = "within", verbose = NULL)
Arguments
x |
Name of the genlight object containing the SNP data [required]. |
metric |
Name of the metric to be used for filtering [required]. |
upper |
Filter upper threshold [required]. |
lower |
Filter lower threshold [required]. |
keep |
Whether to keep loci within the upper and lower thresholds ('within') or outside of them ('outside') [default 'within']. |
verbose |
Verbosity: 0, silent or fatal errors; 1, begin and end; 2, progress log; 3, progress and results summary; 5, full report [default NULL, adopting the global verbosity set by gl.set.verbosity(), or 2 if no global is set]. |
Details
With keep='within', loci with a metric value in the interval [lower, upper] (boundaries included) are retained. With keep='outside', the exact complement is retained: loci with a metric value below lower or above upper. Loci for which the metric is missing (NA) are removed in either mode, because they cannot be assessed against the thresholds.
The fields that are included in dartR, and a short description, are found below. Optionally, the user can also set his/her own filter by adding a vector into $other$loc.metrics as shown in the example.
SnpPosition - position (zero is position 1) in the sequence tag of the defined SNP variant base.
CallRate - proportion of samples for which the genotype call is non-missing (that is, not '-' ).
OneRatioRef - proportion of samples for which the genotype score is 0.
OneRatioSnp - proportion of samples for which the genotype score is 2.
FreqHomRef - proportion of samples homozygous for the Reference allele.
FreqHomSnp - proportion of samples homozygous for the Alternate (SNP) allele.
FreqHets - proportion of samples which score as heterozygous, that is, scored as 1.
PICRef - polymorphism information content (PIC) for the Reference allele.
PICSnp - polymorphism information content (PIC) for the SNP.
AvgPIC - average of the polymorphism information content (PIC) of the Reference and SNP alleles.
AvgCountRef - sum of the tag read counts for all samples, divided by the number of samples with non-zero tag read counts, for the Reference allele row.
AvgCountSnp - sum of the tag read counts for all samples, divided by the number of samples with non-zero tag read counts, for the Alternate (SNP) allele row.
RepAvg - proportion of technical replicate assay pairs for which the marker score is consistent.
Value
The reduced genlight dataset.
Author(s)
Author(s): Luis Mijangos. Custodian: Luis Mijangos – Post to https://groups.google.com/d/forum/dartr
See Also
Other matched filter:
gl.filter.allna(),
gl.filter.callrate(),
gl.filter.contamination(),
gl.filter.excess.het(),
gl.filter.factorloadings(),
gl.filter.hamming(),
gl.filter.heterozygosity(),
gl.filter.hwe(),
gl.filter.ld(),
gl.filter.maf(),
gl.filter.monomorphs(),
gl.filter.overshoot(),
gl.filter.pa(),
gl.filter.rdepth(),
gl.filter.replicates(),
gl.filter.replicates.KING(),
gl.filter.reproducibility(),
gl.filter.secondaries(),
gl.filter.taglength()
Examples
# adding dummy data
if (isTRUE(getOption("dartR_fbm"))) testset.gl <- gl.gen2fbm(testset.gl)
test <- testset.gl
test$other$loc.metrics$test <- 1:nLoc(test)
result <- gl.filter.locmetric(x=test, metric= 'test', upper=255,
lower=200, keep= 'within', verbose=3)
Filters loci on the basis of minor allele frequency (MAF) or minor allele count (MAC)
Description
This script calculates the minor allele frequency for each locus and updates the locus metadata for FreqHomRef, FreqHomSnp, FreqHets and MAF (if it exists). It then uses the updated metadata for MAF to filter loci.
Usage
gl.filter.maf(
  x,
  threshold = 0.01,
  by.pop = FALSE,
  pop.limit = ceiling(nPop(x)/2),
  ind.limit = 10,
  recalc = FALSE,
  plot.display = TRUE,
  plot.theme = theme_dartR(),
  plot.colors = NULL,
  plot.file = NULL,
  plot.dir = NULL,
  bins = 25,
  verbose = NULL
)
Arguments
x |
Name of the genlight object containing the SNP data [required]. |
threshold |
Threshold MAF – loci with a MAF less than the threshold will be removed. If a value > 1 is provided it will be interpreted as MAC (i.e. the minimum number of times an allele needs to be observed) [default 0.01]. |
by.pop |
Whether MAF should be calculated by population [default FALSE]. |
pop.limit |
Minimum number of populations in which MAF should be less than the threshold for a locus to be filtered out. Only used if by.pop = TRUE. The default value is half of the populations [default ceiling(nPop(x)/2)]. |
ind.limit |
Minimum number of individuals that a population should contain to calculate MAF. Only used if by.pop=TRUE [default 10]. |
recalc |
Recalculate the locus metadata statistics [default FALSE]. |
plot.display |
If TRUE, histograms of the MAF distribution pre- and post-filtering are displayed in the plot window [default TRUE]. |
plot.theme |
Theme for the plot. See Details for options [default theme_dartR()]. |
plot.colors |
List of two color names for the borders and fill of the plots [default c("#2171B5", "#6BAED6")]. |
plot.file |
Name for the RDS binary file to save (base name only, exclude extension) [default NULL]. |
plot.dir |
Directory in which to save the plot RDS files [default as specified by the global working directory or tempdir()]. |
bins |
Number of bins to display in histograms [default 25]. |
verbose |
Verbosity: 0, silent or fatal errors; 1, begin and end; 2, progress log; 3, progress and results summary; 5, full report [default 2, unless specified using gl.set.verbosity]. |
Details
Careful consideration needs to be given to the settings to be used for this
function. When the filter is applied globally (i.e. by.pop=FALSE) but
the data include multiple population, there is the risk to remove markers
because the allele frequencies is low (at global level) but the allele
frequencies for the same markers may be high within some of the populations
(especially if the per-population sample size is small). Similarly, not
always it is a sensible choice to run this function using by.pop=TRUE
because allele that are rare in a population may be very common in other,
but the (possible) allele frequencies will depend on the sample size within
each population. Where the purpose of filtering for MAF is to remove possible
spurious alleles (i.e. sequencing errors), it is perhaps better to filter
based on the number of times an allele is observed (MAC, Minimum Allele
Count), under the assumption that if an allele is observed > MAC, it is
fairly rare to be an error.
From v2.1 The threshold can take values > 1. In this case, these are interpreted as a threshold for MAC.
Value
The reduced genlight dataset, returned invisibly. Loci with undefined MAF (all genotypes missing) are removed by the global filter and itemised at verbose >= 3; under by.pop, loci with undefined MAF in a population do not count towards that population's tally.
Author(s)
Author(s): Luis Mijangos. Custodian: Luis Mijangos – Post to https://groups.google.com/d/forum/dartr
See Also
Other matched filter:
gl.filter.allna(),
gl.filter.callrate(),
gl.filter.contamination(),
gl.filter.excess.het(),
gl.filter.factorloadings(),
gl.filter.hamming(),
gl.filter.heterozygosity(),
gl.filter.hwe(),
gl.filter.ld(),
gl.filter.locmetric(),
gl.filter.monomorphs(),
gl.filter.overshoot(),
gl.filter.pa(),
gl.filter.rdepth(),
gl.filter.replicates(),
gl.filter.replicates.KING(),
gl.filter.reproducibility(),
gl.filter.secondaries(),
gl.filter.taglength()
Examples
if (isTRUE(getOption("dartR_fbm"))) platypus.gl <- gl.gen2fbm(platypus.gl)
result <- gl.filter.maf(platypus.gl, threshold = 0.05, verbose = 3)
#result <- gl.filter.maf(platypus.gl, by.pop = TRUE, threshold = 0.05, verbose = 3)
Filters monomorphic loci, including those with all NAs
Description
This script deletes monomorphic loci from a genlight {adegenet} object
Usage
gl.filter.monomorphs(x, verbose = NULL)
Arguments
x |
Name of the input genlight object [required]. |
verbose |
Verbosity: 0, silent or fatal errors; 1, begin and end; 2, progress log; 3, progress and results summary; 5, full report [default 2, unless specified using gl.set.verbosity]. |
Details
A DArT dataset will not have monomorphic loci, but they can arise, along with loci that are scored all NA, when populations or individuals are deleted. Retaining monomorphic loci unnecessarily increases the size of the dataset and will affect some calculations. Note that for SNP data, NAs likely represent null alleles; in tag presence/absence data, NAs represent missing values (presence/absence could not be reliably scored)
Value
A genlight object with monomorphic (and all NA) loci removed.
Author(s)
Author(s): Arthur Georges. Custodian: Arthur Georges – Post to https://groups.google.com/d/forum/dartr
See Also
Other matched filter:
gl.filter.allna(),
gl.filter.callrate(),
gl.filter.contamination(),
gl.filter.excess.het(),
gl.filter.factorloadings(),
gl.filter.hamming(),
gl.filter.heterozygosity(),
gl.filter.hwe(),
gl.filter.ld(),
gl.filter.locmetric(),
gl.filter.maf(),
gl.filter.overshoot(),
gl.filter.pa(),
gl.filter.rdepth(),
gl.filter.replicates(),
gl.filter.replicates.KING(),
gl.filter.reproducibility(),
gl.filter.secondaries(),
gl.filter.taglength()
Examples
# SNP data
if (isTRUE(getOption("dartR_fbm"))) testset.gl <- gl.gen2fbm(testset.gl)
  result <- gl.filter.monomorphs(testset.gl, verbose=3)
# Tag P/A data
  result <- gl.filter.monomorphs(testset.gs, verbose=3)
Filters loci for which the SNP has been trimmed from the sequence tag along with the adaptor
Description
This function checks the position of the SNP within the trimmed sequence tag and identifies those for which the SNP position is outside the trimmed sequence tag. This can happen, rarely, when the sequence containing the SNP resembles the adaptor.
Usage
gl.filter.overshoot(x, verbose = NULL)
Arguments
x |
Name of the genlight object [required]. |
verbose |
Verbosity: 0, silent or fatal errors; 1, begin and end; 2, progress log ; 3, progress and results summary; 5, full report [default NULL, adopting the global verbosity set by gl.set.verbosity(), or 2 if no global is set]. |
Details
The SNP genotype can still be used in most analyses, but functions like gl2fasta() will present challenges if the SNP has been trimmed from the sequence tag.
Not fatal, but should apply this filter before gl.filter.secondaries, for obvious reasons.
Loci for which the overshoot status cannot be assessed (missing TrimmedSequence or SnpPosition) are removed.
Value
A new genlight object with the recalcitrant loci deleted
Author(s)
Author(s): Arthur Georges. Custodian: Arthur Georges – Post to https://groups.google.com/d/forum/dartr
See Also
Other matched filter:
gl.filter.allna(),
gl.filter.callrate(),
gl.filter.contamination(),
gl.filter.excess.het(),
gl.filter.factorloadings(),
gl.filter.hamming(),
gl.filter.heterozygosity(),
gl.filter.hwe(),
gl.filter.ld(),
gl.filter.locmetric(),
gl.filter.maf(),
gl.filter.monomorphs(),
gl.filter.pa(),
gl.filter.rdepth(),
gl.filter.replicates(),
gl.filter.replicates.KING(),
gl.filter.reproducibility(),
gl.filter.secondaries(),
gl.filter.taglength()
Examples
if (isTRUE(getOption("dartR_fbm"))) testset.gl <- gl.gen2fbm(testset.gl)
result <- gl.filter.overshoot(testset.gl, verbose=3)
Filters loci that contain private (and fixed alleles) between two populations
Description
This script is meant to be used prior to gl.nhybrids to maximise the
information content of the SNPs used to identify hybrids (currently
newhybrids allows only 200 SNPs). The idea is to use first all loci that
have fixed alleles between the potential source populations and then 'fill
up' to 200 loci using loci that have private alleles between those
populations. The function filters for those loci. If invers is set to TRUE,
the complement is returned (all loci that are not fixed and have no private
alleles).
Usage
gl.filter.pa(x, pop1, pop2, invers = FALSE, verbose = NULL)
Arguments
x |
Name of the genlight object containing the SNP or SilicoDArT data [required]. |
pop1 |
Name of the first parental population (in quotes) [required]. |
pop2 |
Name of the second parental population (in quotes) [required]. |
invers |
Switch to filter for all loci that have no private alleles and are not fixed [default FALSE]. |
verbose |
Verbosity: 0, silent or fatal errors; 1, begin and end; 2, progress log; 3, progress and results summary; 5, full report [default 2, unless specified using gl.set.verbosity]. |
Value
The reduced genlight dataset, containing only loci with fixed differences or private alleles between the two populations (or the complement if invers = TRUE).
Author(s)
Author(s): Bernd Gruber, Ella Kelly (University of Melbourne). Custodian: Luis Mijangos – Post to https://groups.google.com/d/forum/dartr
See Also
Other matched filter:
gl.filter.allna(),
gl.filter.callrate(),
gl.filter.contamination(),
gl.filter.excess.het(),
gl.filter.factorloadings(),
gl.filter.hamming(),
gl.filter.heterozygosity(),
gl.filter.hwe(),
gl.filter.ld(),
gl.filter.locmetric(),
gl.filter.maf(),
gl.filter.monomorphs(),
gl.filter.overshoot(),
gl.filter.rdepth(),
gl.filter.replicates(),
gl.filter.replicates.KING(),
gl.filter.reproducibility(),
gl.filter.secondaries(),
gl.filter.taglength()
Examples
if (isTRUE(getOption("dartR_fbm"))) testset.gl <- gl.gen2fbm(testset.gl)
result <- gl.filter.pa(testset.gl, pop1 = popNames(testset.gl)[1],
pop2 = popNames(testset.gl)[2], verbose = 3)
Filters loci based on counts of sequence tags scored at a locus (read depth)
Description
SNP datasets generated by DArT report AvgCountRef and AvgCountSnp as counts of sequence tags for the reference and alternate alleles respectively. These can be used to back calculate Read Depth. Fragment presence/absence datasets as provided by DArT (SilicoDArT) provide Average Read Depth and Standard Deviation of Read Depth as standard columns in their report.
This function filters out loci with a read depth below the lower threshold
or above the upper threshold. Loci with a read depth equal to a threshold
are retained. Use the companion function gl.report.rdepth to
choose the thresholds.
Usage
gl.filter.rdepth(
  x,
  lower = 5,
  upper = 1000,
  plot.display = TRUE,
  plot.theme = theme_dartR(),
  plot.colors = NULL,
  plot.file = NULL,
  plot.dir = NULL,
  verbose = NULL
)
Arguments
x |
Name of the genlight object containing the SNP or tag presence/absence data [required]. |
lower |
Lower threshold value below which loci will be removed [default 5]. |
upper |
Upper threshold value above which loci will be removed [default 1000]. |
plot.display |
If TRUE, histograms of read depth before and after filtering are displayed in the plot window [default TRUE]. |
plot.theme |
Theme for the plot. See Details for options [default theme_dartR()]. |
plot.colors |
List of two color names for the borders and fill of the plots [default c("#2171B5", "#6BAED6")]. |
plot.file |
Name for the RDS binary file to save (base name only, exclude extension) [default NULL] |
plot.dir |
Directory in which to save files [default = working directory] |
verbose |
Verbosity: 0, silent or fatal errors; 1, begin and end; 2, progress log; 3, progress and results summary; 5, full report [default NULL, adopting the global verbosity set by gl.set.verbosity(), or 2 if no global is set]. |
Details
Loci for which the read depth metric is missing (NA) are removed, because they cannot be assessed against the thresholds.
For examples of themes, see:
Value
Returns a genlight object retaining loci with a Read Depth in the range specified by the lower and upper threshold.
Author(s)
Custodian: Arthur Georges. Author(s): Arthur Georges (Post to https://groups.google.com/d/forum/dartr)
See Also
Other matched filter:
gl.filter.allna(),
gl.filter.callrate(),
gl.filter.contamination(),
gl.filter.excess.het(),
gl.filter.factorloadings(),
gl.filter.hamming(),
gl.filter.heterozygosity(),
gl.filter.hwe(),
gl.filter.ld(),
gl.filter.locmetric(),
gl.filter.maf(),
gl.filter.monomorphs(),
gl.filter.overshoot(),
gl.filter.pa(),
gl.filter.replicates(),
gl.filter.replicates.KING(),
gl.filter.reproducibility(),
gl.filter.secondaries(),
gl.filter.taglength()
Examples
# SNP data
if (isTRUE(getOption("dartR_fbm"))) testset.gl <- gl.gen2fbm(testset.gl)
  gl.report.rdepth(testset.gl)
  result <- gl.filter.rdepth(testset.gl, lower=8, upper=50, verbose=3)
# Tag P/A data
  result <- gl.filter.rdepth(testset.gs, lower=8, upper=50, verbose=3)

require("dartR.data")
res <- gl.filter.rdepth(platypus.gl)
Remove replicated individuals
Description
Remove replicated individuals
Usage
gl.filter.replicates(
  x,
  replicates.report,
  loc_threshold = 100,
  perc_geno = 0.95,
  recalc = FALSE,
  mono.rm = FALSE,
  verbose = NULL
)
Arguments
x |
Name of the genlight object containing the SNP data [required]. |
replicates.report |
Output of function gl.report.replicates [required]. |
loc_threshold |
Minimum number of loci required to assess that two individuals are replicates [default 100]. |
perc_geno |
Minimum percentage of genotypes in which two individuals should be the same [default 0.95]. |
recalc |
If TRUE, recalculate the locus metadata statistics [default FALSE]. |
mono.rm |
If TRUE, remove monomorphic and all NA loci [default FALSE]. |
verbose |
Verbosity: 0, silent or fatal errors; 1, begin and end; 2, progress log; 3, progress and results summary; 5, full report [default 2, unless specified using gl.set.verbosity]. |
Details
Remove replicated individuals using as input the report from function gl.report.replicates. The user can choose new thresholds for the minimum number of loci required to asses that two individuals are replicates (loc_threshold) and the minimum percentage of genotypes in which two individuals should be the same (perc_geno) from those thresholds use in gl.report.replicates. Note that thresholds can only be tightened relative to those used in gl.report.replicates – the report table contains only the pairs that passed the original thresholds. For each retained pair the member with the higher missing-data rate is removed; ties remove the alphabetically later individual.
Value
A reduced dartR genlight object, returned invisibly
Author(s)
Author(s): Luis Mijangos. Custodian: Luis Mijangos – Post to https://groups.google.com/d/forum/dartr
See Also
Other matched filter:
gl.filter.allna(),
gl.filter.callrate(),
gl.filter.contamination(),
gl.filter.excess.het(),
gl.filter.factorloadings(),
gl.filter.hamming(),
gl.filter.heterozygosity(),
gl.filter.hwe(),
gl.filter.ld(),
gl.filter.locmetric(),
gl.filter.maf(),
gl.filter.monomorphs(),
gl.filter.overshoot(),
gl.filter.pa(),
gl.filter.rdepth(),
gl.filter.replicates.KING(),
gl.filter.reproducibility(),
gl.filter.secondaries(),
gl.filter.taglength()
Examples
t1 <- platypus.gl[1:50,]
res_rep <- gl.report.replicates(t1, loc_threshold = 500,
perc_geno = 0.85)
t2 <- gl.filter.replicates(t1, replicates.report = res_rep, perc_geno = 0.85)
Removes duplicate samples identified by KING-robust kinship
Description
Removes the duplicate samples identified by
gl.report.replicates.KING, keeping one sample of each group
of duplicates.
Usage
gl.filter.replicates.KING(
  x,
  replicates.report,
  king_threshold = 0.354,
  het_threshold = 0.8,
  loc_threshold = 100,
  recalc = FALSE,
  mono.rm = FALSE,
  verbose = NULL
)
Arguments
x |
Name of the genlight object containing the SNP data [required]. |
replicates.report |
Output of |
king_threshold |
KING-robust kinship above which a pair is a duplicate [default 0.354]. |
het_threshold |
Heterozygote share above which a pair is a duplicate; used only when the report was computed from called genotypes [default 0.80]. |
loc_threshold |
Minimum number of loci two samples must share for their pair to be assessed [default 100]. |
recalc |
If TRUE, recalculate the locus metadata statistics [default FALSE]. |
mono.rm |
If TRUE, remove monomorphic and all NA loci [default FALSE]. |
verbose |
Verbosity: 0, silent or fatal errors; 1, begin and end; 2, progress log; 3, progress and results summary; 5, full report [default 2, unless specified using gl.set.verbosity]. |
Details
The pairs are flagged again from replicates.report$table.all with
the thresholds given here: a pair is a duplicate when it shares at least
loc_threshold loci and its KING-robust kinship exceeds
king_threshold or, when the report was computed from called
genotypes (replicates.report$input), its heterozygote share exceeds
het_threshold, as in the report. Because table.all holds every pair, the thresholds
can be loosened as well as tightened, except loc_threshold: pairs
below the report's loc_threshold have no statistics. Flagged pairs
are linked into groups and, in each group, the sample with the lowest
proportion of missing genotypes (replicates.report$ind.miss) is
kept (ties keep the name that sorts first) and the others are removed.
With the report's thresholds the filter removes exactly
replicates.report$ind.list.drop.
Run gl.filter.contamination before this function. Keeping
the sample with the fewest missing genotypes favours a contaminated
sample, as mixed DNA gives more calls: in a ddRAD study of collared
peccaries the pair CP47-CP57 keeps CP57, a mixture of about 4/5 CP47 and
1/5 CP46.
Pairs inside a group that are not flagged themselves are listed with a
warning: such a group can link two animals through a sample that is a
mixture of them, and removing all but one sample would then remove a
different animal. See gl.report.replicates.KING.
Value
The genlight object with the duplicate samples removed, returned invisibly.
Author(s)
Author(s): Luis Mijangos. Custodian: Luis Mijangos – Post to https://groups.google.com/d/forum/dartr
See Also
gl.report.replicates.KING,
gl.filter.replicates
Other matched filter:
gl.filter.allna(),
gl.filter.callrate(),
gl.filter.contamination(),
gl.filter.excess.het(),
gl.filter.factorloadings(),
gl.filter.hamming(),
gl.filter.heterozygosity(),
gl.filter.hwe(),
gl.filter.ld(),
gl.filter.locmetric(),
gl.filter.maf(),
gl.filter.monomorphs(),
gl.filter.overshoot(),
gl.filter.pa(),
gl.filter.rdepth(),
gl.filter.replicates(),
gl.filter.reproducibility(),
gl.filter.secondaries(),
gl.filter.taglength()
Examples
t1 <- platypus.gl[1:50, ]
res <- gl.report.replicates.KING(t1, plot.out = FALSE)
t2 <- gl.filter.replicates.KING(t1, replicates.report = res)
Filters loci in a genlight {adegenet} object based on average repeatability of alleles at a locus
Description
SNP datasets generated by DArT have an index, RepAvg, generated by reproducing the data independently for 30 of alleles that give a repeatable result, averaged over both alleles for each locus. SilicoDArT datasets generated by DArT have a similar index, Reproducibility. For these fragment presence/absence data, repeatability is the percentage of scores that are repeated in the technical replicate dataset.
Usage
gl.filter.reproducibility(
  x,
  threshold = 0.99,
  plot.display = TRUE,
  plot.theme = theme_dartR(),
  plot.colors = NULL,
  plot.file = NULL,
  plot.dir = NULL,
  verbose = NULL
)
Arguments
x |
Name of the genlight object containing the SNP data [required]. |
threshold |
Threshold value below which loci will be removed [default 0.99]. |
plot.display |
If TRUE, histograms of repeatability before and after filtering are displayed in the plot window [default TRUE]. |
plot.theme |
Theme for the plot. See Details for options [default theme_dartR()]. |
plot.colors |
List of two color names for the borders and fill of the plots [default c("#2171B5", "#6BAED6")]. |
plot.file |
Name for the RDS binary file to save (base name only, exclude extension) [default NULL] |
plot.dir |
Directory in which to save files [default = working directory] |
verbose |
Verbosity: 0, silent or fatal errors; 1, begin and end; 2, progress log ; 3, progress and results summary; 5, full report [default NULL, adopting the global verbosity set by gl.set.verbosity(), or 2 if no global is set]. |
Details
Loci for which the repeatability metric is missing (NA) are removed, because they cannot be assessed against the threshold.
Value
Returns a genlight object retaining loci with repeatability (RepAvg or Reproducibility) greater than or equal to the specified threshold.
Author(s)
Custodian: Arthur Georges. Author(s): Arthur Georges – Post to https://groups.google.com/d/forum/dartr
See Also
Other matched filter:
gl.filter.allna(),
gl.filter.callrate(),
gl.filter.contamination(),
gl.filter.excess.het(),
gl.filter.factorloadings(),
gl.filter.hamming(),
gl.filter.heterozygosity(),
gl.filter.hwe(),
gl.filter.ld(),
gl.filter.locmetric(),
gl.filter.maf(),
gl.filter.monomorphs(),
gl.filter.overshoot(),
gl.filter.pa(),
gl.filter.rdepth(),
gl.filter.replicates(),
gl.filter.replicates.KING(),
gl.filter.secondaries(),
gl.filter.taglength()
Examples
# SNP data
if (isTRUE(getOption("dartR_fbm"))) testset.gl <- gl.gen2fbm(testset.gl)
  gl.report.reproducibility(testset.gl)
  result <- gl.filter.reproducibility(testset.gl, threshold=0.99, verbose=3)
# Tag P/A data
  gl.report.reproducibility(testset.gs)
  result <- gl.filter.reproducibility(testset.gs, threshold=0.99)

  res <- gl.filter.reproducibility(testset.gl)
Filters loci that represent secondary SNPs in a genlight object
Description
SNP datasets generated by DArT include fragments with more than one SNP and record them separately with the same CloneID (=AlleleID). These multiple SNP loci within a fragment (secondaries) are likely to be linked, and so you may wish to remove secondaries.
This script filters out all but one locus of those sharing the same CloneID, retaining the SNP with the highest repeatability (RepAvg), and on ties the highest AvgPIC (method='best'), or retaining one at random (method='random').
Usage
gl.filter.secondaries(x, method = "random", verbose = NULL)
Arguments
x |
Name of the genlight object containing the SNP data [required]. |
method |
Method of selecting SNP locus to retain, 'best' or 'random' [default 'random']. |
verbose |
Verbosity: 0, silent or fatal errors; 1, begin and end; 2, progress log; 3, progress and results summary; 5, full report [default NULL, adopting the global verbosity set by gl.set.verbosity(), or 2 if no global is set]. |
Details
The filter has not been implemented for tag presence/absence data.
With method='random' the choice of SNP retained depends on the state of the random number generator; use set.seed() beforehand if reproducibility is required. The locus order of the input object is preserved in the output.
Value
The genlight object, with the secondary SNP loci removed.
Author(s)
Author(s): Arthur Georges. Custodian: Arthur Georges – Post to https://groups.google.com/d/forum/dartr
See Also
Other matched filter:
gl.filter.allna(),
gl.filter.callrate(),
gl.filter.contamination(),
gl.filter.excess.het(),
gl.filter.factorloadings(),
gl.filter.hamming(),
gl.filter.heterozygosity(),
gl.filter.hwe(),
gl.filter.ld(),
gl.filter.locmetric(),
gl.filter.maf(),
gl.filter.monomorphs(),
gl.filter.overshoot(),
gl.filter.pa(),
gl.filter.rdepth(),
gl.filter.replicates(),
gl.filter.replicates.KING(),
gl.filter.reproducibility(),
gl.filter.taglength()
Examples
require("dartR.data")
if (isTRUE(getOption("dartR_fbm"))) platypus.gl <- gl.gen2fbm(platypus.gl)
gl.report.secondaries(platypus.gl)
result <- gl.filter.secondaries(platypus.gl)
Filters loci in a genlight {adegenet} object based on sequence tag length
Description
SNP datasets generated by DArT typically have sequence tag lengths ranging
from 20 to 69 base pairs. This function filters out loci whose sequence tag
length lies below the lower threshold or above the upper threshold. Loci
with a tag length equal to a threshold are retained. Use the companion
function gl.report.taglength to choose the thresholds.
Usage
gl.filter.taglength(x, lower = 20, upper = 69, verbose = NULL)
Arguments
x |
Name of the genlight object containing the SNP data [required]. |
lower |
Lower threshold value below which loci will be removed [default 20]. |
upper |
Upper threshold value above which loci will be removed [default 69]. |
verbose |
Verbosity: 0, silent or fatal errors; 1, begin and end; 2, progress log; 3, progress and results summary; 5, full report [default NULL, adopting the global verbosity set by gl.set.verbosity(), or 2 if no global is set]. |
Details
Loci for which the TrimmedSequence entry is missing (NA) are removed, because their tag length cannot be assessed against the thresholds.
Value
Returns a genlight object retaining loci with a sequence tag length in the range specified by the lower and upper threshold.
Author(s)
Author(s): Arthur Georges. Custodian: Arthur Georges – Post to https://groups.google.com/d/forum/dartr
See Also
Other matched filter:
gl.filter.allna(),
gl.filter.callrate(),
gl.filter.contamination(),
gl.filter.excess.het(),
gl.filter.factorloadings(),
gl.filter.hamming(),
gl.filter.heterozygosity(),
gl.filter.hwe(),
gl.filter.ld(),
gl.filter.locmetric(),
gl.filter.maf(),
gl.filter.monomorphs(),
gl.filter.overshoot(),
gl.filter.pa(),
gl.filter.rdepth(),
gl.filter.replicates(),
gl.filter.replicates.KING(),
gl.filter.reproducibility(),
gl.filter.secondaries()
Examples
# SNP data
if (isTRUE(getOption("dartR_fbm"))) testset.gl <- gl.gen2fbm(testset.gl)
  gl.report.taglength(testset.gl)
  result <- gl.filter.taglength(testset.gl,lower=60)
  gl.report.taglength(result)
# Tag P/A data
  gl.report.taglength(testset.gs)
  result <- gl.filter.taglength(testset.gs,lower=60)
  gl.report.taglength(result)
Generates a matrix of fixed differences and associated statistics for populations taken pairwise
Description
This script takes SNP data or sequence tag P/A data grouped into populations in a genlight object (DArTSeq) and generates a matrix of fixed differences between populations taken pairwise
Usage
gl.fixed.diff(
  x,
  tloc = 0,
  test = FALSE,
  delta = 0.02,
  alpha = 0.05,
  reps = 1000,
  mono.rm = TRUE,
  pb = FALSE,
  verbose = NULL
)
Arguments
x |
Name of the genlight object containing SNP genotypes or tag P/A data (SilicoDArT) or an object of class 'fd' [required]. |
tloc |
Threshold defining a fixed difference (e.g. 0.05 implies 95:5 vs 5:95 is fixed) [default 0]. |
test |
If TRUE, calculate p values for the observed fixed differences [default FALSE]. |
delta |
Threshold value for the true population minor allele frequency (MAF) from which resultant sample fixed differences are considered true positives [default 0.02]. |
alpha |
Level of significance used to display non-significant differences between populations as they are compared pairwise [default 0.05]. |
reps |
Number of replications to undertake in the simulation to estimate probability of false positives [default 1000]. |
mono.rm |
If TRUE, loci that are monomorphic across all individuals are removed before beginning computations [default TRUE]. |
pb |
If TRUE, show a progress bar on time consuming loops (displayed when verbose >= 2) [default FALSE]. |
verbose |
Verbosity: 0, silent or fatal errors; 1, begin and end; 2, progress log; 3, progress and results summary; 5, full report [default 2 or as specified using gl.set.verbosity]. |
Details
A fixed difference at a locus occurs when two populations share no alleles or where all members of one population has a sequence tag scored, and all members of the other population has the sequence tag absent. The challenge with this approach is that when sample sizes are finite, fixed differences will occur through sampling error, compounded when many loci are examined. Simulations suggest that sample sizes of n1=5 and n2=5 are adequate to reduce the probability of [experiment-wide] type 1 error to negligible levels [ploidy=2]. A warning is issued (at verbose >= 3) if the minimum sample size in the dataset is less than 10. Optionally, if test=TRUE, the script will test the fixed differences between final OTUs for statistical significance, using simulation, and then further amalgamate populations that for which there are no significant fixed differences at a specified level of significance (alpha). To avoid conflation of true fixed differences with false positives in the simulations, it is necessary to decide a threshold value (delta) for extreme true allele frequencies that will be considered fixed for practical purposes. That is, fixed differences in the sample set will be considered to be positives (not false positives) if they arise from true allele frequencies of less than 1-delta in one or both populations. The parameter delta is typically set to be small (e.g. delta = 0.02). NOTE: The above test will only be calculated if tloc=0, that is, for analyses of absolute fixed differences. The test applies in comparisons of allopatric populations only. For sympatric populations, use gl.fdsim() with sympatric = TRUE. An absolute fixed difference is as defined above. However, one might wish to score fixed differences at some lower level of allele frequency difference, say where percent allele frequencies are 95,5 and 5,95 rather than 100:0 and 0:100. This adjustment can be done with the tloc parameter. For example, tloc=0.05 means that SNP allele frequencies of 95,5 and 5,95 percent will be regarded as fixed when comparing two populations at a locus.
Value
A list of Class 'fd' containing the gl object and square matrices, as follows:
$gl – the output genlight object;
$fd – raw fixed differences;
$pcfd – percent fixed differences;
$nobs – mean no. of individuals used in each comparison;
$nloc – total number of loci used in each comparison;
$expfpos – if test=TRUE, the expected count of false positives for each comparison [by simulation];
$sdfpos – if test=TRUE, the standard deviation of the count of false positives for each comparison [by simulation];
$pval – if test=TRUE, the significance of the count of fixed differences [by simulation])
Author(s)
Author(s): Arthur Georges. Custodian: Arthur Georges – Post to https://groups.google.com/d/forum/dartr
See Also
Other fixed difference analysis:
gl.fdsim()
Examples
if (isTRUE(getOption("dartR_fbm"))) testset.gl <- gl.gen2fbm(testset.gl)
fd <- gl.fixed.diff(testset.gl, tloc=0, verbose=3 )
fd <- gl.fixed.diff(testset.gl, tloc=0, test=TRUE, delta=0.02, reps=100, verbose=3 )
Calculates pairwise Fst between populations in a genlight object
Description
Calculates the pairwise fixation index Fst between every pair of populations in a genlight object, with optional bootstrap confidence intervals and p-values obtained by resampling loci.
Usage
gl.fst.pop(x, nboots = 1, percent = 95, nclusters = 1, verbose = NULL)
Arguments
x |
Name of the genlight containing the SNP genotypes [required]. |
nboots |
Number of bootstrap replicates over loci used to generate confidence intervals and p-values. A whole number; 1 returns the point estimates alone [default 1]. |
percent |
Percentile to calculate the confidence interval around, greater than 0 and less than 100 [default 95]. |
nclusters |
Ignored. It set the number of cores used by StAMPP, which is no longer called; kept so that existing calls still work [default 1]. |
verbose |
Verbosity: 0, silent or fatal errors; 1, begin and end; 2, progress log; 3, progress and results summary; 5, full report [default NULL, adopting the global verbosity set by gl.set.verbosity(), or 2 if no global is set]. |
Details
The statistic is Weir and Cockerham's (1984) theta, estimated from allele
frequencies, observed heterozygosities and per-locus sample sizes
computed separately for each population. The estimator is the one of
stamppFst and gives identical values; it is
computed by dartR from blocks of loci, so file-backed objects (see
gl.gen2fbm) are not converted to memory, and it is much
faster. Theta is a variance-components estimator that corrects for
unequal sample sizes, so it is not the same quantity as the Nei (1987)
Gst-family statistics reported by gl.report.fstat under the
same word "Fst"; the two can differ substantially on unevenly sampled
data. Loci missing from one member of a pair contribute nothing to that
pair.
Bootstrap. When nboots is greater than 1 the function
resamples loci with replacement, nLoc at a time, and recomputes
theta on each replicate with the same estimator that produced the point
estimate. The locus is the unit of resampling because it is the unit the
variance components are summed over. The replicates are drawn in the
calling session, so set.seed() immediately before the call makes
the confidence limits and the p-values reproducible. There is no
seed parameter. The point estimates do not depend on the bootstrap
and are the same whatever nboots is set to.
Confidence limits. The limits are the order statistics of the
sorted replicates at positions ceiling(a * nboots) and
floor((1 - a) * nboots), where a = ((100 - percent)/100)/2.
At the default percent = 95 the lower position is 1 for every
nboots up to 40, so with 40 or fewer replicates the reported lower
limit is the smallest replicate rather than the 2.5th percentile and the
interval is the observed range. The function warns at
verbose >= 1 whenever the requested percentile cannot be reached.
P-values. The p-value for a pair is the one-tailed bootstrap
fraction mean(replicates <= 0): the proportion of replicate thetas
at or below zero. Its resolution is 1/nboots, and it can be
exactly 0 or exactly 1. A p of 1 means every replicate was at or below
zero, which is what undifferentiated populations produce; it is a failure
to reject, not evidence of no differentiation. No correction for multiple
testing is applied across the nPop*(nPop-1)/2 pairs tested, which
is 435 pairs for a 30-population object. Apply one yourself if the
pairwise tests are to be read as a family.
Non-finite pairs. A pair returns NaN when the estimator cannot
be formed, most often because a population holds a single individual or
because no locus is polymorphic in the pair. Such pairs are named at
verbose >= 1.
Value
A base matrix of class c("matrix", "array") when
nboots is 1: nPop x nPop, with the pairwise theta values in the
lower triangle and NA on the diagonal and in the upper triangle. It is
not an object of class dist. Rows and columns are named by
population in order of first appearance in the data, not in factor-level
order. Use as.matrix(as.dist(fsts)) for a symmetric square matrix.
When nboots is greater than 1, a list of three elements:
-
Fsts- the same lower-triangular nPop x nPop matrix. -
Pvalues- an nPop x nPop matrix of p-values, lower triangle populated. -
Bootstraps- a data frame with one row per pair of populations and columns "Population1", "Population2", thenbootsreplicate thetas sorted in increasing order, "Lower bound CI limit", "Upper bound CI limit", "p-value" and "Fst".
Author(s)
Author(s): Bernd Gruber. Custodian: Bernd Gruber – Post to https://groups.google.com/d/forum/dartr
References
Weir, B.S. and Cockerham, C.C. (1984). Estimating F-statistics for the analysis of population structure. Evolution 38, 1358-1370.
See Also
gl.report.fstat, which reports the Nei (1987)
Gst-family statistics Fst, Fstp, Dest and Gst_H rather than the Weir and
Cockerham theta returned here.
Other distance:
gl.dist.ind(),
gl.dist.pop(),
gl.propShared(),
utils.dist.ind.snp()
Examples
if (isTRUE(getOption("dartR_fbm"))) platypus.gl <- gl.gen2fbm(platypus.gl)
test <- gl.filter.callrate(platypus.gl,threshold = 1)
test <- gl.filter.monomorphs(test)
out <- gl.fst.pop(test, nboots=1)
Converts a gen-backed genlight object to a file-backed (FBM) one
Description
'gl.gen2fbm()' converts a 'dartR'/'genlight' object that stores genotypes in the standard list-of-'SNPbin' format ('@gen') into an 'FBM.code256' stored in the '@fbm' slot (and clears '@gen', enforcing XOR).
The genotypes are copied in **blocks of loci** read directly from the
packed bits of the 'SNPbin' objects, so the full genotype matrix is never
decoded in memory. Each value is held as one byte while it is copied. The
block size follows the bigstatsr option bigstatsr.block.sizeGB
(default 1): a block holds as many loci as
bigstatsr::block_size(nInd(x)), and the peak memory use of the
conversion is roughly that option in Gb. Lower it (e.g.
options(bigstatsr.block.sizeGB = 0.1)) to convert with less memory.
Only diploid SNP data (genotypes 0, 1, 2 or missing) can be stored. The FBM uses the value 3 for a missing genotype, so data with higher dosages (e.g. polyploids) are refused with an error instead of being silently turned into missing values.
**Saving.** The FBM holds only a reference to its backing file, which by
default is a temporary file deleted at the end of the R session. Save a
file-backed object with gl.save (and reload it with
gl.load), never with saveRDS(): saveRDS() stores
only the reference, not the genotypes. After saving, check that the file
size makes sense for the number of individuals and loci (a file of a few
Kb for thousands of loci means the genotypes were not saved).
Usage
gl.gen2fbm(
  x,
  code = bigsnpr::CODE_012,
  backingfile = NULL,
  chunk = NULL,
  verbose = NULL
)
Arguments
x |
A **'dartR'** (preferred) or **'genlight'** object that currently has genotype data only in '@gen' (i.e., no FBM yet). A plain 'genlight' is converted to 'dartR' first. Only SNP data are supported. |
code |
A 'bigsnpr' code mapping for 'FBM.code256'. Defaults to 'bigsnpr::CODE_012' (0/1/2 with 'NA' support). |
backingfile |
File stem for the FBM backing file. If NULL, a temporary
file in the folder |
chunk |
Deprecated. Number of loci per block; if given, it replaces
the block size derived from |
verbose |
Verbosity: 0, silent or fatal errors; 1, begin and end; 2, progress log; 3, progress and results summary; 5, full report [default NULL, adopting the global verbosity set by gl.set.verbosity(), or 2 if no global is set]. |
Value
A **'dartR'** object with '@fbm' populated and '@gen' emptied. An object that is already FBM-backed is returned unchanged.
Author(s)
Author(s): Luis Mijangos. Custodian: Luis Mijangos – Post to https://groups.google.com/d/forum/dartr
See Also
Other data manipulation:
gl.add.indmetrics(),
gl.define.pop(),
gl.drop.ind(),
gl.drop.loc(),
gl.drop.pop(),
gl.edit.recode.pop(),
gl.fbm.cleanup(),
gl.fbm2gen(),
gl.impute(),
gl.join(),
gl.keep.ind(),
gl.keep.loc(),
gl.keep.pop(),
gl.make.recode.ind(),
gl.make.recode.pop(),
gl.merge.pop(),
gl.reassign.ind(),
gl.reassign.pop(),
gl.recode.ind(),
gl.recode.pop(),
gl.rename.pop(),
gl.sample(),
gl.sim.genotypes(),
gl.sort(),
gl.subsample.ind(),
gl.subsample.loc(),
gl.subsample.loci()
Examples
x <- gl.gen2fbm(testset.gl)
nInd(x); nLoc(x)            # dimensions via FBM
as.matrix(x)[1:5, 1:5]      # decodes from FBM
Performs Hardy-Weinberg tests over loci and populations
Description
Hardy-Weinberg tests are performed for each loci in each of the populations as defined by the pop slot in a genlight object.
Usage
gl.hwe.pop(
  x,
  alpha_val = 0.05,
  plot.out = TRUE,
  plot_theme = theme_dartR(),
  plot_colors = c("gray90", "deeppink"),
  HWformat = FALSE,
  verbose = NULL
)
Arguments
x |
A genlight object with a population defined [pop(x) does not return NULL]. |
alpha_val |
Level of significance for testing [default 0.05]. |
plot.out |
If TRUE, the plot is drawn and returned in the list; otherwise the plot element is NULL [default TRUE]. |
plot_theme |
User specified theme [default theme_dartR()]. |
plot_colors |
Vector with two color names, for non-significant and significant tests [default c("gray90", "deeppink")]. |
HWformat |
Switch if data should be returned in HWformat (counts of
Genotypes to be used in package |
verbose |
Verbosity: 0, silent or fatal errors; 1, begin and end; 2, progress log ; 3, progress and results summary; 5, full report [default NULL, adopting the global verbosity set by gl.set.verbosity(), or 2 if no global is set]. |
Details
This function employs the HardyWeinberg package, which needs to be
installed. The function that is used is
HWExactStats, but there are several other great
functions implemented in the package regarding HWE. Therefore, this function
can return the data in the format expected by the HWE package expects, via
HWformat=TRUE and then use this to run other functions of the package.
This functions performs a HWE test for every population (rows) and loci
(columns) and returns a true false matrix. True is reported if the p-value of
an HWE-test for a particular loci and population was below the specified
threshold (alpha_val, default=0.05). The thinking behind this approach is
that loci that are not in HWE in several populations have most likely to be
treated (e.g. filtered if loci under selection are of interest). If
plot.out = TRUE a raster plot of significant tests over loci (columns)
and populations (rows) is drawn and returned. Loci that deviate in the
majority of populations can be identified via colSums on the resulting
matrix.
Plot themes can be obtained from
Value
The function returns a list with up to three components:
'HWE' is the matrix over loci and populations
'plot' is a plot (ggplot) which shows the significant results for population and loci (can be amended further using ggplot syntax)
'HWEformat=TRUE' the 'HWformat' entails SNP data for each population in 'HardyWeinberg'-format to be used with other functions of the package (e.g
HWPermorHWExactPrevious).
Author(s)
Author(s): Arthur Georges. Custodian: Arthur Georges – Post to https://groups.google.com/d/forum/dartr
Examples
if (isTRUE(getOption("dartR_fbm"))) bandicoot.gl <- gl.gen2fbm(bandicoot.gl)
out <- gl.hwe.pop(bandicoot.gl[,1:33], alpha_val=0.05, plot.out=TRUE, HWformat=FALSE)
Imputes missing data
Description
This function imputes genotypes on a population-by-population basis, where populations can be considered panmictic, or imputes the state for presence-absence data.
Usage
gl.impute(
  x,
  method = "neighbour",
  fill.residual = TRUE,
  parallel = FALSE,
  beagle.bin.path = getwd(),
  plink.bin.path = getwd(),
  verbose = NULL
)
Arguments
x |
Name of the genlight object containing the SNP or presence-absence data [required]. |
method |
Imputation method, either "frequency" or "HW" or "neighbour" or "random" or "beagle" [default "neighbour"]. |
fill.residual |
Should any residual missing values remaining after imputation be filled at random, drawing from the global allele profile at the particular locus (for presence-absence data, a Bernoulli draw with the global band frequency) [default TRUE]. |
parallel |
A logical indicating whether multiple cores -if available- should be used for the computations (TRUE), or not (FALSE); requires the package parallel to be installed [default FALSE]. |
beagle.bin.path |
Path of beagle.27Feb25.75f.jar file [default getwd()]. |
plink.bin.path |
Path of PLINK binary file [default getwd()]. |
verbose |
Verbosity: 0, silent or fatal errors; 1, begin and end; 2, progress log; 3, progress and results summary; 5, full report [default NULL, adopting the global verbosity set by gl.set.verbosity(), or 2 if no global is set]. |
Details
We recommend that imputation be performed on sampling locations, before any aggregation. Imputation is achieved by replacing missing values using either of five methods:
If "frequency", a genotype scored as missing at a locus in an individual is set deterministically from the allele frequencies at that locus in the population from which the individual was drawn. For SNP genotype data the imputed value is the expected genotype dosage 2q (q being the frequency of the alternate allele in that population) rounded to the nearest valid genotype (0, 1 or 2); exact ties (2q = 0.5 or 2q = 1.5) resolve to the heterozygote (1). For presence-absence data the imputed value is the more frequent band state (0 or 1) in the population; a tie (band frequency exactly 0.5) resolves to presence (1). This method involves no random draw – repeated runs give identical results (values filled by fill.residual remain random draws).
If "HW", a genotype scored as missing at a locus in an individual is drawn at random. For SNP genotype data the draw assumes Hardy-Weinberg equilibrium, using the genotype probabilities (p^2, 2pq, q^2) at that locus in the population. For presence-absence data the draw is Bernoulli with the band frequency at that locus in the population.
If "neighbour", substitute the missing values for the focal individual with the values taken from the nearest neighbour. Repeat with next nearest and so on until all missing values are replaced.
if "random", missing data are substituted by values drawn at random with equal probability from the valid genotypes (0, 1 or 2 for SNP genotype data; 0 or 1 for presence-absence data).
if "beagle", missing data is imputed using using BEAGLE (beagle.27Feb25.75f.jar), which infers missing genotypes by modelling shared haplotype patterns among individuals. Applies only to SNP genotype data. Beagle can be downloaded using the following link:
https://faculty.washington.edu/browning/beagle/beagle.html#download.
After downloading the Beagle binary move it to your working directory.
For method = "beagle" it is also required to download the binary file of PLINK 1.9 and move it to your working directory. The binary file can be downloaded from:
The spelling "neighbor" is accepted as an alias for "neighbour".
The nearest neighbour is the one at the smallest Euclidean distance from the focal individual.
The advantage of this approach is that it works regardless of how many individuals are in the population to which the focal individual belongs, and the displacement of the individual is haphazard as opposed to: (a) Drawing the individual toward the population centroid (HW and Frequency). (b) Drawing the individual toward the global centroid (glPCA).
Note that loci that are missing for all individuals in a population are not imputed with method 'frequency' or 'HW' and can give unpredictable results for particular individuals using 'neighbour'.
Consider using the function
gl.filter.allna with by.pop=TRUE to remove them first.
Loci scored NA across all individuals in the dataset cannot be imputed
from allele frequencies or neighbours: with methods 'frequency', 'HW' and
'neighbour' they remain NA in the returned object, regardless of
fill.residual (the global frequency at such loci is undefined). Method
'random' substitutes unconditioned random values at such loci. Use
gl.filter.allna (without by.pop) to remove them first.
File-backed objects (see gl.gen2fbm) are imputed in blocks
of loci, without decoding the whole genotype matrix; the block size
follows options(bigstatsr.block.sizeGB). The imputed genotypes are
written into a new backing file, and the input is left unchanged. The
result is identical to that for the same data held in memory, including
the random draws with the same seed (method 'HW' reads the file once per
population to keep that order). Method 'neighbour' holds the matrix of
distances between individuals in memory (8 bytes per pair, e.g. 32 Mb for
2,000 individuals). Method 'beagle' exports the data to a VCF file, which
decodes the genotypes.
Value
A genlight object with the missing data imputed.
Author(s)
Author(s): Luis Mijangos. Custodian: Luis Mijangos – Post to https://groups.google.com/d/forum/dartr
References
Browning, B. L., & Browning, S. R. (2016). Genotype imputation with millions of reference samples. American Journal of Human Genetics, 98(1), 116-126. https://doi.org/10.1016/j.ajhg.2015.11.020
See Also
Other data manipulation:
gl.add.indmetrics(),
gl.define.pop(),
gl.drop.ind(),
gl.drop.loc(),
gl.drop.pop(),
gl.edit.recode.pop(),
gl.fbm.cleanup(),
gl.fbm2gen(),
gl.gen2fbm(),
gl.join(),
gl.keep.ind(),
gl.keep.loc(),
gl.keep.pop(),
gl.make.recode.ind(),
gl.make.recode.pop(),
gl.merge.pop(),
gl.reassign.ind(),
gl.reassign.pop(),
gl.recode.ind(),
gl.recode.pop(),
gl.rename.pop(),
gl.sample(),
gl.sim.genotypes(),
gl.sort(),
gl.subsample.ind(),
gl.subsample.loc(),
gl.subsample.loci()
Examples
require("dartR.data")
# SNP genotype data
if (isTRUE(getOption("dartR_fbm"))) platypus.gl <- gl.gen2fbm(platypus.gl)
gl <- gl.filter.callrate(platypus.gl,threshold=0.95)
gl <- gl.filter.allna(gl)
gl <- gl.impute(gl, method="frequency")
# Sequence Tag presence-absence data
gs <- gl.filter.callrate(testset.gs,threshold=0.95)
gs <- gl.filter.allna(gs)
gs <- gl.impute(gs, method="neighbour")

gl <- gl.impute(platypus.gl,method ="random")
Combines two dartR genlight objects
Description
This function combines two genlight objects and their associated metadata. The history of the new genlight object is taken from the first genlight object, with the gl.join call appended. Either the individuals/samples must be the same in each genlight object, in which case the new genlight object has the same individuals but combined loci, or the loci must be the same in each genlight object in which case the new genlight object has the same loci but combined individuals/samples. The function is typically used to combine datasets from the same service where the files have been split because of size limitations. The data is read in from multiple csv files, then the resultant genlight objects are combined.
This function works with both SNP and Tag P/A data.
Usage
gl.join(x1, x2, method = NULL, verbose = NULL)
Arguments
x1 |
Name of the first genlight object [required]. |
x2 |
Name of the second genlight object [required]. |
method |
Legacy parameter, deprecated and no longer required. Accepted legacy values for backward compatibility: 'join.by.loc' or 'end2end' (same loci, individuals combined); 'join.by.ind' or 'sidebyside' (same individuals, loci combined) [default NULL]. |
verbose |
Verbosity: 0, silent or fatal errors; 1, begin and end; 2, progress log; 3, progress and results summary; 5, full report [default 2 or as specified using gl.set.verbosity]. |
Details
This script joins two genlight objects together along with the associated metadata. The join mode is detected automatically: if the two objects have identical individuals (in the same order), the loci are combined; if they have identical loci (in the same order), the individuals are combined. Individual names duplicated across the two objects are made unique. The legacy method parameter is deprecated and no longer required; the historical values 'join.by.loc'/'end2end' (join by shared loci) and 'join.by.ind'/'sidebyside' (join by shared individuals) remain accepted for backward compatibility, and the requested join is validated against the data.
Value
A new genlight object with the combined data and metadata.
Author(s)
Author(s): Arthur Georges. Custodian: Arthur Georges – Post to https://groups.google.com/d/forum/dartr
See Also
Other data manipulation:
gl.add.indmetrics(),
gl.define.pop(),
gl.drop.ind(),
gl.drop.loc(),
gl.drop.pop(),
gl.edit.recode.pop(),
gl.fbm.cleanup(),
gl.fbm2gen(),
gl.gen2fbm(),
gl.impute(),
gl.keep.ind(),
gl.keep.loc(),
gl.keep.pop(),
gl.make.recode.ind(),
gl.make.recode.pop(),
gl.merge.pop(),
gl.reassign.ind(),
gl.reassign.pop(),
gl.recode.ind(),
gl.recode.pop(),
gl.rename.pop(),
gl.sample(),
gl.sim.genotypes(),
gl.sort(),
gl.subsample.ind(),
gl.subsample.loc(),
gl.subsample.loci()
Examples
if (isTRUE(getOption("dartR_fbm"))) testset.gl <- gl.gen2fbm(testset.gl)
# Joining by loci in common, both datasets have the same loci in the same order
x1 <- testset.gl[1:7, ]
nInd(x1)
x2 <- testset.gl[11:14, ]
nInd(x2)
gl <- gl.join(x1, x2, verbose = 4)
nInd(gl)
# Joining by individuals in common, both datasets have the same individuals
# in the same order
if (isTRUE(getOption("dartR_fbm"))) platypus.gl <- gl.gen2fbm(platypus.gl)
x1 <- platypus.gl[, 1:100]
nLoc(x1)
x2 <- platypus.gl[, 101:200]
nLoc(x2)
gl <- gl.join(x1, x2, verbose=3)
nLoc(gl)

# Join by adding individuals with a set of common loci
nInd(testset.gl)
x1 <- gl.drop.ind(testset.gl,ind.list=c("AA010915","UC_00126","AA032760","AA013214",
"AA011723","AA012411","AA019237","AA019238","AA019239","AA019235","AA019240",
"AA019241","AA019242","AA019243"))
nInd(x1)
x2 <- gl.keep.ind(testset.gl,ind.list=c("AA010915","UC_00126","AA032760","AA013214",
"AA011723","AA012411","AA019237","AA019238","AA019239","AA019235","AA019240",
"AA019241","AA019242","AA019243"))
nInd(x2)
gl <- gl.join(x1, x2, verbose=3)
nInd(gl)
Removes all but the specified individuals from a dartR genlight object
Description
This script deletes all individuals apart from those listed (ind.list). Monomorphic loci and loci that are scored all NA are optionally deleted (mono.rm=TRUE). The script also optionally recalculates locus metatdata statistics to accommodate the deletion of individuals from the dataset (recalc=TRUE). The script returns a dartR genlight object with the retained individuals and the recalculated locus metadata. The script works with both genlight objects containing SNP genotypes and Tag P/A data (SilicoDArT).
Usage
gl.keep.ind(x, ind.list, recalc = FALSE, mono.rm = FALSE, verbose = NULL)
Arguments
x |
Name of the genlight object [required]. |
ind.list |
A list of individuals to be retained [required]. |
recalc |
If TRUE, recalculate the locus metadata statistics [default FALSE]. |
mono.rm |
If TRUE, remove monomorphic and all NA loci [default FALSE]. |
verbose |
Verbosity: 0, silent or fatal errors; 1, begin and end; 2, progress log; 3, progress and results summary; 5, full report [default 2 or as specified using gl.set.verbosity]. |
Value
A reduced dartR genlight object
Author(s)
Author(s): Arthur Georges. Custodian: Arthur Georges – Post to https://groups.google.com/d/forum/dartr
See Also
gl.drop.pop to drop rather than keep specified populations
Other data manipulation:
gl.add.indmetrics(),
gl.define.pop(),
gl.drop.ind(),
gl.drop.loc(),
gl.drop.pop(),
gl.edit.recode.pop(),
gl.fbm.cleanup(),
gl.fbm2gen(),
gl.gen2fbm(),
gl.impute(),
gl.join(),
gl.keep.loc(),
gl.keep.pop(),
gl.make.recode.ind(),
gl.make.recode.pop(),
gl.merge.pop(),
gl.reassign.ind(),
gl.reassign.pop(),
gl.recode.ind(),
gl.recode.pop(),
gl.rename.pop(),
gl.sample(),
gl.sim.genotypes(),
gl.sort(),
gl.subsample.ind(),
gl.subsample.loc(),
gl.subsample.loci()
Examples
  # SNP data
  if (isTRUE(getOption("dartR_fbm"))) testset.gl <- gl.gen2fbm(testset.gl)
    gl2 <- gl.keep.ind(testset.gl, ind.list=c('AA019073','AA004859'))
  # Tag P/A data
   gs2 <- gl.keep.ind(testset.gs, ind.list=c('AA020656','AA19077','AA004859'))
Removes all but the specified loci from a genlight object
Description
This function deletes loci that are not specified to keep, and their associated metadata. The script returns a dartR genlight object with the retained loci. The script works with both genlight objects containing SNP genotypes and Tag P/A data (SilicoDArT).
Usage
gl.keep.loc(x, loc.list = NULL, first = NULL, last = NULL, verbose = NULL)
Arguments
x |
Name of the genlight object [required]. |
loc.list |
A list of loci to be kept [required, if loc.range not specified]. |
first |
First of a range of loci to be kept [required, if loc.list not specified]. |
last |
Last of a range of loci to be kept [if not specified, last locus in the dataset]. |
verbose |
Verbosity: 0, silent or fatal errors; 1, begin and end; 2, progress but not results; 3, progress and results summary; 5, full report [default 2 or as specified using gl.set.verbosity]. |
Value
A genlight object with the reduced data
Author(s)
Author(s): Arthur Georges. Custodian: Arthur Georges – Post to https://groups.google.com/d/forum/dartr
See Also
gl.drop.loc to drop rather than keep specified loci
Other data manipulation:
gl.add.indmetrics(),
gl.define.pop(),
gl.drop.ind(),
gl.drop.loc(),
gl.drop.pop(),
gl.edit.recode.pop(),
gl.fbm.cleanup(),
gl.fbm2gen(),
gl.gen2fbm(),
gl.impute(),
gl.join(),
gl.keep.ind(),
gl.keep.pop(),
gl.make.recode.ind(),
gl.make.recode.pop(),
gl.merge.pop(),
gl.reassign.ind(),
gl.reassign.pop(),
gl.recode.ind(),
gl.recode.pop(),
gl.rename.pop(),
gl.sample(),
gl.sim.genotypes(),
gl.sort(),
gl.subsample.ind(),
gl.subsample.loc(),
gl.subsample.loci()
Examples
# SNP data
 if (isTRUE(getOption("dartR_fbm"))) testset.gl <- gl.gen2fbm(testset.gl)
  gl2 <- gl.keep.loc(testset.gl, loc.list=c('100051468|42-A/T', '100049816-51-A/G'))
# Tag P/A data
  gs2 <- gl.keep.loc(testset.gs, loc.list=c('20134188','19249144'))
Removes all but the specified populations from a dartR genlight object
Description
Individuals are assigned to populations based on associated specimen metadata stored in the dartR genlight object. This script deletes all individuals apart from those in listed populations (pop.list). Monomorphic loci and loci that are scored all NA are optionally deleted (mono.rm=TRUE). The script also optionally recalculates locus metatdata statistics to accommodate the deletion of individuals from the dataset (recalc=TRUE). The script returns a dartR genlight object with the retained populations and the recalculated locus metadata. The script works with both genlight objects containing SNP genotypes and Tag P/A data (SilicoDArT).
Usage
gl.keep.pop(
  x,
  pop.list,
  as.pop = NULL,
  recalc = FALSE,
  mono.rm = FALSE,
  verbose = NULL
)
Arguments
x |
Name of the genlight object [required]. |
pop.list |
List of populations to be retained [required]. |
as.pop |
Temporarily assign another locus metric as the population for the purposes of deletions [default NULL]. |
recalc |
If TRUE, recalculate the locus metadata statistics [default FALSE]. |
mono.rm |
If TRUE, remove monomorphic and all NA loci [default FALSE]. |
verbose |
Verbosity: 0, silent or fatal errors; 1, begin and end; 2, progress but not results; 3, progress and results summary; 5, full report [default 2 or as specified using gl.set.verbosity]. |
Value
A reduced dartR genlight object
Author(s)
Author(s): Arthur Georges. Custodian: Arthur Georges – Post to https://groups.google.com/d/forum/dartr
See Also
gl.drop.pop to drop rather than keep specified populations
Other data manipulation:
gl.add.indmetrics(),
gl.define.pop(),
gl.drop.ind(),
gl.drop.loc(),
gl.drop.pop(),
gl.edit.recode.pop(),
gl.fbm.cleanup(),
gl.fbm2gen(),
gl.gen2fbm(),
gl.impute(),
gl.join(),
gl.keep.ind(),
gl.keep.loc(),
gl.make.recode.ind(),
gl.make.recode.pop(),
gl.merge.pop(),
gl.reassign.ind(),
gl.reassign.pop(),
gl.recode.ind(),
gl.recode.pop(),
gl.rename.pop(),
gl.sample(),
gl.sim.genotypes(),
gl.sort(),
gl.subsample.ind(),
gl.subsample.loc(),
gl.subsample.loci()
Examples
 # SNP data
 if (isTRUE(getOption("dartR_fbm"))) testset.gl <- gl.gen2fbm(testset.gl)
   gl2 <- gl.keep.pop(testset.gl, pop.list=c('EmsubRopeMata', 'EmvicVictJasp'))
   gl2 <- gl.keep.pop(testset.gl, pop.list=c('EmsubRopeMata', 'EmvicVictJasp'),
   mono.rm=TRUE,recalc=TRUE)
   gl2 <- gl.keep.pop(testset.gl, pop.list=c('Female'),as.pop='sex')
 # Tag P/A data
   gs2 <- gl.keep.pop(testset.gs, pop.list=c('EmsubRopeMata','EmvicVictJasp'))
Loads an object from compressed binary format produced by gl.save()
Description
This is a wrapper for readRDS() The function reads the object from the nominated file, checks if it is a dartR genlight object, converts it if it is not, and returns the gl object. A compliance check can be requested.
Objects of class dartR saved by the legacy dartR package are converted to dartR.base objects without loading the legacy package (which would mask the dartR.base functions), and also when it is not installed. A file-backed (FBM) object saved with saveRDS() instead of gl.save() can only be loaded while its backing file (.bk) exists; otherwise gl.load() stops with an error.
Usage
gl.load(file, fbm = FALSE, compliance = FALSE, verbose = NULL)
Arguments
file |
Name of the file from which to read the saved object [required]. |
fbm |
Whether to convert dartR-gen object to dartR-fbm object [default FALSE]. |
compliance |
Whether to undertake a compliance check [default FALSE]. |
verbose |
Verbosity: 0, silent or fatal errors; 1, begin and end; 2, progress log; 3, progress and results summary; 5, full report [default 2 or as specified using gl.set.verbosity]. |
Value
The loaded object, returned invisibly
Author(s)
Author(s): Arthur Georges. Custodian: Arthur Georges – Post to https://groups.google.com/d/forum/dartr
See Also
Other io:
gl.read.PLINK(),
gl.read.csv(),
gl.read.dart(),
gl.read.fasta(),
gl.read.silicodart(),
gl.save(),
gl.write.csv(),
utils.read.dart()
Examples
f <- file.path(tempdir(), 'testset.rds')
gl.save(testset.gl, f)
gl <- gl.load(f)
Creates a proforma recode_ind file for reassigning individual (=specimen) names
Description
Renaming individuals may be required when there have been errors in labeling arising in the process from sample to sequencing files. There may be occasions where renaming individuals is required for preparation of figures.
Usage
gl.make.recode.ind(
  x,
  out.recode.file = "default_recode_ind.csv",
  outpath = NULL,
  verbose = NULL
)
Arguments
x |
Name of the genlight object [required]. |
out.recode.file |
File name of the output file (including extension) [default default_recode_ind.csv]. |
outpath |
Directory in which to save the proforma recode file [default as specified by the global working directory or tempdir()] |
verbose |
Verbosity: 0, silent or fatal errors; 1, begin and end; 2, progress log; 3, progress and results summary; 5, full report [default NULL, adopting the global verbosity set by gl.set.verbosity(), or 2 if no global is set]. |
Details
This function facilitates the construction of a recode table by producing a proforma file with current individual (=specimen) names in two identical columns. Edit the second column to reassign individual names. Use keyword 'Delete' to delete an individual. When caution needs to be exercised because of the potential for breaking the 'chain of evidence' associated with the samples, recoding individuals using a recode table (csv) can provide a clear record of the changes. Use outpath=getwd() when calling this function to direct output files to your working directory. The function works with both genlight objects containing SNP genotypes and Tag P/A data (SilicoDArT). Apply the recoding using gl.recode.ind().
Value
NULL, returned invisibly. The proforma recode table is written to the nominated file.
Author(s)
Author(s): Arthur Georges. Custodian: Arthur Georges – Post to https://groups.google.com/d/forum/dartr
See Also
Other data manipulation:
gl.add.indmetrics(),
gl.define.pop(),
gl.drop.ind(),
gl.drop.loc(),
gl.drop.pop(),
gl.edit.recode.pop(),
gl.fbm.cleanup(),
gl.fbm2gen(),
gl.gen2fbm(),
gl.impute(),
gl.join(),
gl.keep.ind(),
gl.keep.loc(),
gl.keep.pop(),
gl.make.recode.pop(),
gl.merge.pop(),
gl.reassign.ind(),
gl.reassign.pop(),
gl.recode.ind(),
gl.recode.pop(),
gl.rename.pop(),
gl.sample(),
gl.sim.genotypes(),
gl.sort(),
gl.subsample.ind(),
gl.subsample.loc(),
gl.subsample.loci()
Examples
if (isTRUE(getOption("dartR_fbm"))) testset.gl <- gl.gen2fbm(testset.gl)
result <- gl.make.recode.ind(testset.gl, out.recode.file ='Emmac_recode_ind.csv',outpath=tempdir())
Creates a proforma recode_pop_table file for reassigning population names
Description
Renaming populations may be required when there have been errors in assignment arising in the process from sample to sequence files or when one wishes to amalgamate populations, or delete populations. Recoding populations can also be done with a recode table (csv).
Usage
gl.make.recode.pop(
  x,
  out.recode.file = "recode_pop_table.csv",
  outpath = NULL,
  verbose = NULL
)
Arguments
x |
Name of the genlight object [required]. |
out.recode.file |
File name of the output file (including extension) [default recode_pop_table.csv]. |
outpath |
Directory in which to save the proforma recode file [default as specified by the global working directory or tempdir()] |
verbose |
Verbosity: 0, silent or fatal errors; 1, begin and end; 2, progress log; 3, progress and results summary; 5, full report [default NULL, adopting the global verbosity set by gl.set.verbosity(), or 2 if no global is set]. |
Details
This function facilitates the construction of a recode table by producing a proforma file with current population names in two identical columns. Edit the second column to reassign populations. Use keyword 'Delete' to delete a population. When caution needs to be exercised because of the potential for breaking the 'chain of evidence' associated with the samples, recoding populations using a recode table (csv) can provide a clear record of the changes. Use outpath=getwd() when calling this function to direct output files to your working directory. The function works with both genlight objects containing SNP genotypes and Tag P/A data (SilicoDArT). Apply the recoding using gl.recode.pop().
Value
NULL, returned invisibly. The proforma recode table is written to the nominated file.
Author(s)
Author(s): Arthur Georges. Custodian: Arthur Georges – Post to https://groups.google.com/d/forum/dartr
See Also
Other data manipulation:
gl.add.indmetrics(),
gl.define.pop(),
gl.drop.ind(),
gl.drop.loc(),
gl.drop.pop(),
gl.edit.recode.pop(),
gl.fbm.cleanup(),
gl.fbm2gen(),
gl.gen2fbm(),
gl.impute(),
gl.join(),
gl.keep.ind(),
gl.keep.loc(),
gl.keep.pop(),
gl.make.recode.ind(),
gl.merge.pop(),
gl.reassign.ind(),
gl.reassign.pop(),
gl.recode.ind(),
gl.recode.pop(),
gl.rename.pop(),
gl.sample(),
gl.sim.genotypes(),
gl.sort(),
gl.subsample.ind(),
gl.subsample.loc(),
gl.subsample.loci()
Examples
if (isTRUE(getOption("dartR_fbm"))) testset.gl <- gl.gen2fbm(testset.gl)
result <- gl.make.recode.pop(testset.gl,out.recode.file='test.csv',outpath=tempdir(),verbose=2)
Creates an interactive map (based on latlon) from a genlight object
Description
Plots the individuals of a genlight object on an interactive leaflet map,
using the coordinates stored in x@other$latlon, with optional
population labels and optional links between populations or individuals
drawn from a distance matrix.
Usage
gl.map.interactive(
  x,
  matrix = NULL,
  standard = TRUE,
  symmetric = TRUE,
  pop.labels = TRUE,
  pop.labels.cex = 12,
  ind.circles = TRUE,
  ind.circle.cols = rainbow,
  ind.circle.cex = 10,
  ind.circle.transparency = 0.8,
  palette.links = NULL,
  legend.title = NULL,
  provider = "Esri.NatGeoWorldMap",
  scale.bar = TRUE,
  raster.image = NULL,
  raster.opacity = 0.5,
  raster.colors = (scales::viridis_pal(option = "D"))(255),
  verbose = NULL
)
Arguments
x |
A genlight object (including coordinates within the latlon slot) [required]. |
matrix |
A distance matrix between populations or individuals, either
a square matrix or a |
standard |
If a matrix is provided, values are standardised to be between 1 and 10 if set to TRUE, otherwise taken as given. Symmetric links use the value for line colour and width; asymmetric links use it for arrow thickness [default TRUE]. |
symmetric |
If a symmetric matrix is provided only one line is drawn based on the lower triangle of the matrix. If set to false arrows indicating the direction are used instead [default TRUE]. |
pop.labels |
Population labels at the center of the individuals of populations [default TRUE]. |
pop.labels.cex |
Size of population labels [default 12]. |
ind.circles |
Should individuals be plotted as circles [default TRUE]. |
ind.circle.cols |
Colors of circles. A color palette or a vector with as many colors as there are populations in the dataset [default rainbow]. |
ind.circle.cex |
Size of circles in pixels [default 10]. |
ind.circle.transparency |
Transparency of circles between 0=invisible and 1=no transparency [default 0.8]. |
palette.links |
Color palette for the symmetric links in case a matrix
is provided. Ignored when |
legend.title |
Legend's title for the symmetric links in case a matrix is provided [default NULL]. |
provider |
Passed to leaflet [default "Esri.NatGeoWorldMap"]. |
scale.bar |
Whether to add a scale bar [default TRUE]. |
raster.image |
Path to a georeferenced raster image to plot [default NULL]. |
raster.opacity |
The opacity of the raster, expressed from 0 to 1 [default 0.5]. |
raster.colors |
The color palette to use to color the raster values [default scales::viridis_pal(option = "D")(255)]. |
verbose |
Verbosity: 0, silent or fatal errors; 1, begin and end; 2, brief progress messages; 3, progress and results summary; 5, full report [default 2, unless specified using gl.set.verbosity]. |
Details
A wrapper around the leaflet package. For possible background maps check as specified via the provider: http://leaflet-extras.github.io/leaflet-providers/preview/index.html
The palette.links argument can be any of the following: A character vector of RGB or named colors. Examples: palette(), c("#000000", "#0000FF", "#FFFFFF"), topo.colors(10)
The name of an RColorBrewer palette, e.g. "BuPu" or "Greens".
The full name of a viridis palette: "viridis", "magma", "inferno", or "plasma".
A function that receives a single value between 0 and 1 and returns a color. Examples: colorRamp(c("#000000", "#FFFFFF"), interpolate = "spline").
Symmetric links are drawn only for pairs whose value is above 0 and not missing; a pair with a missing value in an asymmetric matrix is skipped in that direction and drawn in grey in the other.
Value
A leaflet map (htmlwidget), displayed when printed.
Author(s)
Author(s): Bernd Gruber. Custodian: Bernd Gruber – Post to https://groups.google.com/d/forum/dartr
See Also
Other graphics:
gl.colors(),
gl.plot.heatmap(),
gl.plot.snp.density(),
gl.select.colors(),
gl.select.shapes(),
gl.smearplot(),
gl.tree.nj()
Examples
require("dartR.data")
if (isTRUE(getOption("dartR_fbm"))) bandicoot.gl <- gl.gen2fbm(bandicoot.gl)
gl.map.interactive(bandicoot.gl)
cols <- c("red","blue","yellow")
if (isTRUE(getOption("dartR_fbm"))) platypus.gl <- gl.gen2fbm(platypus.gl)
gl.map.interactive(platypus.gl, ind.circle.cols=cols, ind.circle.cex=10,
ind.circle.transparency=0.5)
Merges two or more populations in a dartR genlight object into one population
Description
This function assigns individuals from two or more nominated populations into a new single population. It can also be used to rename populations. The function works with both SNP and Tag P/A (silicoDArT) data. The function returns a genlight object with the new population assignments.
Usage
gl.merge.pop(x, old = NULL, new = NULL, verbose = NULL)
Arguments
x |
Name of the genlight object [required]. |
old |
A list of populations to be merged [required]. |
new |
Name of the new population [required]. |
verbose |
Verbosity: 0, silent or fatal errors; 1, begin and end; 2, progress log; 3, progress and results summary; 5, full report [default 2 or as specified using gl.set.verbosity]. |
Value
A genlight object with the new population assignments.
Author(s)
Author(s): Arthur Georges. Custodian: Arthur Georges – Post to https://groups.google.com/d/forum/dartr
See Also
Other data manipulation:
gl.add.indmetrics(),
gl.define.pop(),
gl.drop.ind(),
gl.drop.loc(),
gl.drop.pop(),
gl.edit.recode.pop(),
gl.fbm.cleanup(),
gl.fbm2gen(),
gl.gen2fbm(),
gl.impute(),
gl.join(),
gl.keep.ind(),
gl.keep.loc(),
gl.keep.pop(),
gl.make.recode.ind(),
gl.make.recode.pop(),
gl.reassign.ind(),
gl.reassign.pop(),
gl.recode.ind(),
gl.recode.pop(),
gl.rename.pop(),
gl.sample(),
gl.sim.genotypes(),
gl.sort(),
gl.subsample.ind(),
gl.subsample.loc(),
gl.subsample.loci()
Examples
if (isTRUE(getOption("dartR_fbm"))) testset.gl <- gl.gen2fbm(testset.gl)
   gl <- gl.merge.pop(testset.gl, old=c('EmsubRopeMata','EmvicVictJasp'), new='Outgroup')
Ordination applied to genotypes in a genlight object (PCA), in an fd object, or to a distance matrix (PCoA)
Description
This function takes the genotypes for individuals and undertakes a Pearson Principal Component analysis (PCA) on SNP or Sequence tag P/A (SilicoDArT) data; it undertakes a Gower Principal Coordinate analysis (PCoA) if supplied with a distance matrix.
Usage
gl.pcoa(
  x,
  nfactors = 5,
  pc.select = "broken-stick",
  correction = NULL,
  mono.rm = TRUE,
  parallel = FALSE,
  n.cores = 1,
  plot.out = TRUE,
  plot.theme = theme_dartR(),
  plot.colors = gl.colors(2),
  plot.file = NULL,
  plot.dir = NULL,
  verbose = NULL
)
Arguments
x |
Name of the genlight object or fd object containing the SNP data, or a distance matrix of type dist [required]. |
nfactors |
Number of axes to retain in the output of factor scores [default 5]. |
pc.select |
Method for identifying substantial PC axes. One of Kaiser-Guttman, broken-stick, Tracy-Widom [default broken-stick] |
correction |
Method applied to correct for negative eigenvalues, either 'lingoes' or 'cailliez' [Default NULL]. |
mono.rm |
If TRUE, remove monomorphic loci [default TRUE]. |
parallel |
TRUE if parallel processing is required (does fail under Windows) [default FALSE]. |
n.cores |
Number of cores to use if parallel processing is requested [default 16]. |
plot.out |
If TRUE, a diagnostic plot is displayed showing a scree plot for the "informative" axes and a histogram of eigenvalues of the remaining "noise" axes [Default TRUE]. |
plot.theme |
Theme for the plot. See Details for options [default theme_dartR()]. |
plot.colors |
List of two color names for the borders and fill of the plot [default gl.colors(2)]. |
plot.file |
Name for the RDS binary file to save (base name only, exclude extension) [default NULL] |
plot.dir |
Directory to save the plot RDS files [default as specified by the global working directory or tempdir()] |
verbose |
verbose= 0, silent or fatal errors; 1, begin and end; 2, progress log; 3, progress and results summary; 5, full report [default 2 or as specified using gl.set.verbosity]. |
Details
The function is essentially a wrapper for glPca {adegenet} or pcoa {ape} with default settings apart from those specified as parameters in this function.
Two algorithms are used for the PCA, depending on how the genotypes are stored. For ordinary (in-memory) genlight objects the PCA is undertaken with glPca {adegenet}, which replaces missing values with the mean of their locus. For file-backed (FBM) dartR objects the PCA is computed from the backing file in blocks with {bigstatsr}. Missing values are replaced by the mean of their locus there too (rounded to two decimal places, as snp_fastImputeSimple {bigsnpr} stores it), in a temporary copy, so the two algorithms give the same ordination and the object passed in is not altered. To ordinate genotypes imputed in another way, run gl.impute() first.
Sources of stress in the visual representation While, technically, any distance matrix can be represented in an ordinated space, the representation will not typically be exact.There are three major sources of stress in a reduced-representation of distances or dissimilarities among entities using PCA or PCoA. By far the greatest source comes from the decision to select only the top two or three axes from the ordinated set of axes derived from the PCA or PCoA. The representation of the entities such a heavily reduced space will not faithfully represent the distances in the input distance matrix simply because of the loss of information in deeper informative dimensions. For this reason, it is not sensible to be too precious about managing the other two sources of stress in the visual representation. The measure of distance between entities in a PCA is the Pearson Correlation Coefficient, essentially a standardized Euclidean distance. This is both a metric distance and a Euclidean distance and so the distances in the final ordination are faithful to those between entities in the dataset. Note that missing values are imputed in PCA, and that this can be a source of disparity between the distances between the entities in the dataset and the distances in the ordinated space.
In PCoA, the second source of stress is the choice of distance measure or dissimilarity measure. While pretty much any distance or dissimilarity matrix can be represented in an ordinated space, the distances between entities can be faithfully represented in that space (that is, without stress) only if the distances are metric. Furthermore, for distances between entities to be faithfully represented in a rigid Cartesian space, the distance measure needs to be Euclidean. If this is not the case, the distances between the entities in the ordinated visualized space will not #' exactly represent the distances in the input matrix (stress will be non-zero). This source of stress will be evident as negative eigenvalues in the deeper dimensions.
A third source of stress arises from having a sparse dataset, one with missing values. This affects both PCA and PCoA. If the original data matrix is not fully populated, that is, if there are missing values, then even a Euclidean distance matrix will not necessarily be 'positive definite'. It follows that some of the eigenvalues may be negative, even though the distance metric is Euclidean. This issue is exacerbated when the number of loci greatly exceeds the number of individuals, as is typically the case when working with SNP data. The impact of missing values can be minimized by stringently filtering on Call Rate, albeit with loss of data. An alternative is given in a paper 'Honey, I shrunk the sample covariance matrix' and more recently by Ledoit and Wolf (2018), but their approach has not been implemented here.
Options for imputing missing values while minimizing distortion are provided in the function gl.impute(). The good news is that, unless the sum of the negative eigenvalues, arising from a non-Euclidean distance measure or from missing values, approaches those of the final PCA or PCoA axes to be displayed, the distortion is probably of no practical consequence and certainly not comparable to the stress arising from selecting only two or three final dimensions out of several informative dimensions for the visual representation. Function's output Two diagnostic plots are produced. The first is a Scree Plot, showing the percentage variation explained by each of the PCA or PCoA axes, for those axes are considered informative. The scree plot informs a decision on the number of dimensions to be retained in the visual summaries. Various approaches are available for identifying which axes are informative (in terms of containing biologically significant variation) and which are noise axes. The simplest method is to consider only those axes that explain more variance than the original variables on average as being informative (pc.select="Kaiser-Guttman"). A second method (the default) is the broken-stick method (pc.select="broken-stick"). A third method is the Tracy-Widom statistical approach (pc.select="Tracy-Widom").
Once you have the informative axes identified, a judgement call is made as to how many dimensions to retain and present as results. This requires a decision on how much information on structure in the data is to be discarded. Retaining at least those axes that explain 10 The second graph is for diagnostic purposes only. It shows the distribution of eigenvalues for the remaining uninformative (noise) axes, including those with negative eigenvalues. If a plot.file is given, the ggplot arising from this function is saved as an binary file using gl.save(); can be reloaded with gl.load(). A file name must be specified for the plot to be saved. If a plot directory (plot.dir) is specified, the ggplot binary is saved to that directory; otherwise to the tempdir(). Action is recommended (verbose >= 2) if the negative eigenvalues are dominant, their sum approaching in magnitude the eigenvalues for axes selected for the final visual solution. Output is a glPca object conforming to adegenet::glPca but with only the following retained.
$call - The call that generated the PCA/PCoA
$eig - Eigenvalues – All eigenvalues (positive, null, negative).
$scores - Scores (coefficients) for each individual
$loadings - Loadings of each SNP for each principal component
Examples of other themes that can be used can be consulted in
PCA was developed by Pearson (1901) and Hotelling (1933), whilst the best modern reference is Jolliffe (2002). PCoA was developed by Gower (1966) while the best modern reference is Legendre & Legendre (1998).
Value
An object of class pcoa containing the eigenvalues and factor scores
Author(s)
Author(s): Arthur Georges and Jesus Castrejon. Custodian: Arthur Georges (Post to https://groups.google.com/d/forum/dartr)
References
Cailliez, F. (1983) The analytical solution of the additive constant problem. Psychometrika, 48, 305-308.
Gower, J. C. (1966) Some distance properties of latent root and vector methods used in multivariate analysis. Biometrika, 53, 325-338.
Hotelling, H., 1933. Analysis of a complex of statistical variables into Principal Components. Journal of Educational Psychology 24:417-441, 498-520.
Jolliffe, I. (2002) Principal Component Analysis. 2nd Edition, Springer, New York.
Ledoit, O. and Wolf, M. (2018). Analytical nonlinear shrinkage of large-dimensional covariance matrices. University of Zurich, Department of Economics, Working Paper No. 264, Revised version. Available at SSRN: https://ssrn.com/abstract=3047302 or http://dx.doi.org/10.2139/ssrn.3047302
Legendre, P. and Legendre, L. (1998). Numerical Ecology, Volume 24, 2nd Edition. Elsevier Science, NY.
Lingoes, J. C. (1971) Some boundary conditions for a monotone analysis of symmetric matrices. Psychometrika, 36, 195-203.
Pearson, K. (1901). On lines and planes of closest fit to systems of points in space. Philosophical Magazine. Series 6, vol. 2, no. 11, pp. 559-572.
See Also
Examples
# PCA (using SNP genlight object)
gl <- possums.gl[1:90,]
if (isTRUE(getOption("dartR_fbm"))) gl <- gl.gen2fbm(gl)
pca <- gl.pcoa(gl,verbose=2)
gl.pcoa.plot(pca,gl)

gs <- testset.gs
levels(pop(gs))<-c(rep('Coast',5),rep('Cooper',3),rep('Coast',5),
rep('MDB',8),rep('Coast',6),'Em.subglobosa','Em.victoriae')
# PCA (using SilicoDArT genlight object)
pca <- gl.pcoa(gs)
gl.pcoa.plot(pca,gs)
# Using a distance matrix
D <- gl.dist.ind(testset.gs, method='jaccard')
pcoa <- gl.pcoa(D,correction="cailliez")
gl.pcoa.plot(pcoa,gs)
Bivariate or trivariate plot of the results of an ordination generated using gl.pcoa()
Description
This script takes output from the ordination generated by gl.pcoa() and plots the individuals classified by population.
Usage
gl.pcoa.plot(
  glPca,
  x,
  scale = FALSE,
  ellipse = FALSE,
  plevel = 0.95,
  pop.labels = "pop",
  interactive = FALSE,
  as.pop = NULL,
  hadjust = 1.5,
  vadjust = 1,
  xaxis = 1,
  yaxis = 2,
  zaxis = NULL,
  pt.size = 2,
  pt.colors = NULL,
  pt.shapes = NULL,
  label.size = 1,
  axis.label.size = 1.5,
  plot.display = TRUE,
  plot.theme = theme_dartR(),
  plot.file = NULL,
  plot.dir = NULL,
  verbose = NULL
)
Arguments
glPca |
Name of the PCA or PCoA object containing the factor scores and eigenvalues [required]. |
x |
Name of the genlight object or fd object containing the SNP genotypes or Tag P/A (SilicoDArT) genotypes [required to gain access to metadata]. |
scale |
If TRUE, scale the x and y axes in proportion to % variation explained [default FALSE]. |
ellipse |
If TRUE, display ellipses to encapsulate points for each population [default FALSE]. |
plevel |
Value of the percentile for the ellipse to encapsulate points for each population [default 0.95]. |
pop.labels |
How labels will be added to the plot ['none'|'ind'|'pop'|'legend', default = 'pop']. |
interactive |
If TRUE then the populations are plotted without labels, mouse-over to identify points [default FALSE]. |
as.pop |
Assign another metric to represent populations for the plot [default NULL]. |
hadjust |
Horizontal justification of the label against the point it annotates in 2D plots; 0.5 centres the label on the point, larger values shift it to the left [default 1.5]. |
vadjust |
Vertical justification of the label against the point it annotates in 2D plots; 0.5 centres the label on the point, larger values shift it downward [default 1]. |
xaxis |
Identify the x axis from those available in the ordination (xaxis <= nfactors) [default 1]. |
yaxis |
Identify the y axis from those available in the ordination (yaxis <= nfactors) [default 2]. |
zaxis |
Identify the z axis from those available in the ordination for a 3D plot (zaxis <= nfactors) [default NULL]. |
pt.size |
Specify the size of the displayed points [default 2]. |
pt.colors |
Optionally provide a vector of nPop colors (run gl.select.colors() for color options) [default NULL]. |
pt.shapes |
Optionally provide a vector of nPop shapes (run gl.select.shapes() for shape options); not applied to the 3D plot [default NULL]. |
label.size |
Specify the size of the point labels [default 1]. |
axis.label.size |
Specify the size of the displayed axis labels [default 1.5]. |
plot.display |
If TRUE, the resultant plot is displayed in the plot window [default TRUE]. |
plot.theme |
Theme for the plot [default theme_dartR()]. |
plot.file |
Name for the RDS binary file to save (base name only, exclude extension) [default NULL]. |
plot.dir |
Directory to save the plot RDS files [default as specified by the global working directory or tempdir()]. |
verbose |
Verbosity: 0, silent or fatal errors; 1, begin and end; 2, progress log; 3, progress and results summary; 5, full report [default 2 or as specified using gl.set.verbosity]. |
Details
The factor scores are taken from the output of gl.pcoa() and the population assignments are taken from from the original data file. In the bivariate plots, the specimens are shown optionally with adjacent labels and enclosing ellipses. Population labels on the plot are shuffled so as not to overlap (using package {directlabels}). This can be a bit clunky, as the labels may be some distance from the points to which they refer, but it provides the opportunity for moving labels around using graphics software (e.g. Adobe Illustrator). Labels are selected with pop.labels – 'pop' labels each cluster of points with its population name, 'ind' labels each point with its individual name, 'legend' identifies populations in a legend beside the plot, and 'none' plots the points alone. The hadjust and vadjust parameters set the justification of those labels against the point they annotate. 3D plotting is activated by specifying a zaxis. Any pair or trio of axes can be specified from the ordination, provided they are within the range of the nfactors value provided to gl.pcoa(). In the 2D plots, axes can be scaled to represent the proportion of variation explained. In any case, the proportion of variation explained by each axis is provided in the axis label. Colors and shapes of the points can be altered by passing a vector of shapes and/or a vector of colors. These vectors can be created with gl.select.shapes() and gl.select.colors() and passed to this script using the pt.shapes and pt.colors parameters. Shapes are not available in the 3D plot. Points displayed in the ordination can be identified if the option interactive=TRUE is chosen, in which case the resultant plot is ggplotly() friendly. Identification of points is by moving the mouse over them. Refer to the plotly package for further information. The interactive option is automatically enabled for 3D plotting.
If a plot.file is given, the ggplot arising from this function is saved as an "RDS" binary file using saveRDS(); can be reloaded with readRDS(). A file name must be specified for the plot to be saved. If a plot directory (plot.dir) is specified, the ggplot binary is saved to that directory; otherwise to the tempdir().
Value
The plot object – a ggplot for the 2D plots, a plotly htmlwidget for the interactive and 3D plots, and a gganimate object for an ordination of a list of simulated generations. The object is returned visibly, so an unassigned call renders the plot.
Author(s)
Author(s): Arthur Georges. Custodian: Arthur Georges – Post to https://groups.google.com/d/forum/dartr
See Also
Examples
if (isTRUE(getOption("dartR_fbm"))) platypus.gl <- gl.gen2fbm(platypus.gl)
 test <- gl.pcoa(platypus.gl)
 gl.pcoa.plot(glPca = test, x = platypus.gl)

# SET UP DATASET
gl <- testset.gl
levels(pop(gl))<-c(rep('Coast',5),rep('Cooper',3),rep('Coast',5),
rep('MDB',8),rep('Coast',7),'Em.subglobosa','Em.victoriae')
# RUN PCA
pca<-gl.pcoa(gl,nfactors=5)
# VARIOUS EXAMPLES
gl.pcoa.plot(pca, gl, ellipse=TRUE, plevel=0.95, pop.labels='pop',
axis.label.size=1, hadjust=1.5,vadjust=1)
gl.pcoa.plot(pca, gl, ellipse=TRUE, plevel=0.99, pop.labels='legend',
axis.label.size=1)
gl.pcoa.plot(pca, gl, ellipse=TRUE, plevel=0.99, pop.labels='legend',
axis.label.size=1.5,scale=TRUE)
gl.pcoa.plot(pca, gl, ellipse=TRUE, axis.label.size=1.2, xaxis=1, yaxis=3,
scale=TRUE)
gl.pcoa.plot(pca, gl, pop.labels='none',scale=TRUE)
#gl.pcoa.plot(pca, gl,  interactive=TRUE)
gl.pcoa.plot(pca, gl, ellipse=TRUE, plevel=0.99, xaxis=1, yaxis=2, zaxis=3)
# COLOR AND SHAPE ADJUSTMENTS
shp <- gl.select.shapes(select=c(16,17,17,0,2))
col <- gl.select.colors(library='brewer',palette='Spectral',ncolors=11,
select=c(1,9,3,11,11))
gl.pcoa.plot(pca, gl, ellipse=TRUE, plevel=0.95, pop.labels='pop',
pt.colors=col, pt.shapes=shp, axis.label.size=1, hadjust=1.5,vadjust=1)
gl.pcoa.plot(pca, gl, ellipse=TRUE, plevel=0.99, pop.labels='legend',
 pt.colors=col, pt.shapes=shp, axis.label.size=1)
# DISTANCE MATRIX
 D <- gl.dist.ind(gl)
 pco <- gl.pcoa(D)
 gl.pcoa.plot(pco,gl,ellipse=TRUE)
Represents a distance matrix as a heatmap
Description
Plots a heat map of the values in a distance or dissimilarity matrix,
with optional row and column dendrograms. When a genlight object is
supplied, individuals are coloured by population in side bars and a
legend. The heat map is drawn by utils.heatmap, a modified
copy of gplots::heatmap.2.
Usage
gl.plot.heatmap(
  D,
  x = NULL,
  palette.divergent = gl.colors("div", verbose = 0),
  palette_discrete = NULL,
  dendrogram = "column",
  plot.out = TRUE,
  legend.print = TRUE,
  legendx = 0,
  legendy = 0.5,
  label.size = 0.75,
  legend.title = "Populations",
  diag.na = FALSE,
  margins = c(10, 10),
  na.color = "grey",
  revC = FALSE,
  symbreaks = FALSE,
  trace = "none",
  tracecol = "cyan",
  cexRow = NULL,
  cexCol = NULL,
  srtRow = NULL,
  srtCol = 90,
  offsetRow = 0.5,
  offsetCol = 0.5,
  key = TRUE,
  keysize = 1.5,
  density.info = "none",
  denscol = "cyan",
  symkey = FALSE,
  densadj = 0.25,
  key.title = NULL,
  key.xlab = NULL,
  key.ylab = NULL,
  main = NULL,
  xlab = NULL,
  ylab = NULL,
  verbose = NULL,
  ...
)
Arguments
D |
Distance matrix (class |
x |
Genlight object used to colour individuals by population [default NULL]. |
palette.divergent |
A divergent palette function for the values [default gl.colors("div")]. |
palette_discrete |
Colours for the populations of |
dendrogram |
Which dendrograms to draw: 'none', 'row', 'column' or 'both' [default "column"]. |
plot.out |
Whether to draw the heat map [default TRUE]. |
legend.print |
Whether to draw the population legend (only when
|
legendx |
x position of the legend, 0-1, or a legend keyword [default 0]. |
legendy |
y position of the legend, 0-1 [default 0.5]. |
label.size |
Size of the population labels in the legend [default 0.75]. |
legend.title |
Legend title [default "Populations"]. |
diag.na |
If TRUE, the diagonal of the matrix is set to NA and drawn
in |
margins |
Numeric vector of length 2: margins for column and row names, respectively [default c(10, 10)]. |
na.color |
Colour for missing values (NA) [default "grey"]. |
revC |
Reverse column order [default FALSE]. |
symbreaks |
Symmetric colour breaks around zero [default FALSE]. |
trace |
Trace lines: "column", "row", "both" or "none" [default "none"]. |
tracecol |
Trace line colour [default "cyan"]. |
cexRow |
Row label scale [default NULL, chosen from the number of rows]. |
cexCol |
Column label scale [default NULL, chosen from the number of columns]. |
srtRow |
Row label rotation angle [default NULL]. |
srtCol |
Column label rotation angle [default 90]. |
offsetRow |
Row label offset [default 0.5]. |
offsetCol |
Column label offset [default 0.5]. |
key |
Draw the colour key [default TRUE]. |
keysize |
Size of the colour key [default 1.5]. |
density.info |
Density plot on the colour key: "histogram", "density" or "none" [default "none"]. |
denscol |
Density plot colour [default "cyan"]. |
symkey |
Symmetric colour key around zero [default FALSE]. |
densadj |
Density plot bandwidth adjustment [default 0.25]. |
key.title |
Title of the colour key [default NULL]. |
key.xlab |
X label of the colour key [default NULL]. |
key.ylab |
Y label of the colour key [default NULL]. |
main |
Main plot title [default NULL]. |
xlab |
X-axis label [default NULL]. |
ylab |
Y-axis label [default NULL]. |
verbose |
Verbosity: 0, silent or fatal errors; 1, begin and end; 2, brief progress messages; 3, progress and results summary; 5, full report [default 2, unless specified using gl.set.verbosity]. |
... |
Further arguments passed to |
Details
D can be a dist object (for example from
gl.dist.ind or gl.dist.pop), a square numeric
matrix with matching row and column names, or an object of class
fd from gl.fixed.diff, in which case the raw fixed
difference matrix ($fd) is plotted. A matrix is plotted as
supplied: its diagonal and both triangles are drawn, so a relatedness
matrix keeps its self-relatedness values and an asymmetric matrix keeps
both directions. If one triangle is entirely NA, it is filled from
the other. Set diag.na = TRUE to leave the diagonal blank.
Population colours are drawn when every column of D names an
individual of x. When D is at the population level
(gl.dist.pop, fd), x is ignored. When some columns
of D are not individuals of x, no colours are drawn and a
warning is printed at verbose >= 1.
legendx and legendy position the legend in the 0-1
coordinates of the plotting region; legendx also accepts a
keyword such as "topleft" (see legend).
Value
Invisibly, the list returned by utils.heatmap
(row and column orders, the plotted matrix, dendrograms, breaks and
colours), or NULL when plot.out = FALSE.
Author(s)
Author(s): Luis Mijangos. Custodian: Luis Mijangos – Post to https://groups.google.com/d/forum/dartr
See Also
Other graphics:
gl.colors(),
gl.map.interactive(),
gl.plot.snp.density(),
gl.select.colors(),
gl.select.shapes(),
gl.smearplot(),
gl.tree.nj()
Examples
if (requireNamespace("dendextend", quietly = TRUE)) {
  gl <- testset.gl[1:10, ]
  D <- dist(as.matrix(gl))
  gl.plot.heatmap(D, x = gl)
  D2 <- gl.dist.pop(possums.gl)
  gl.plot.heatmap(D2)
}

D3 <- gl.fixed.diff(testset.gl)
gl.plot.heatmap(D3)
Plot SNP density along chromosomes (heat-map)
Description
Generates a tiled heat-map of single-nucleotide polymorphisms (SNPs) across chromosomes or scaffolds in a genlight object. SNPs are binned into fixed-width windows and coloured by SNP count, optionally annotating chromosomes with their SNP number and the position of their last SNP (Mb).
Usage
gl.plot.snp.density(
  x,
  bin.size = 1e+06,
  min.snps = 50,
  min.length = 1e+06,
  color.palette = viridis::viridis,
  chr.info = TRUE,
  plot.title = NULL,
  plot.theme = theme_dartR(),
  plot.display = TRUE,
  plot.file = NULL,
  plot.dir = NULL,
  verbose = NULL
)
Arguments
x |
A genlight object with chromosome names in |
bin.size |
Width (bp) of the genomic bins used to count SNPs [default 1e6]. |
min.snps |
Minimum number of positioned SNPs a chromosome must have to be plotted [default 50]. |
min.length |
Minimum position (bp) of the last SNP for a chromosome to be plotted [default 1e6]. |
color.palette |
A function returning a vector of colours, passed to ggplot2; typically viridis::viridis [default viridis::viridis]. |
chr.info |
If TRUE, append (N SNPs, L Mb) to the chromosome labels [default TRUE]. |
plot.title |
Main title for the plot [default NULL]. |
plot.theme |
User specified theme [default theme_dartR()]. |
plot.display |
Specify if plot is to be displayed in the graphics window [default TRUE]. |
plot.file |
Filename (minus extension) for the RDS plot file [Required for plot save]. |
plot.dir |
Directory to save the plot RDS file [default as specified by the global working directory or tempdir()]. |
verbose |
Verbosity: 0, silent or fatal errors; 1, begin and end; 2, brief progress messages; 3, progress and results summary; 5, full report [default 2, unless specified using gl.set.verbosity]. |
Details
Chromosome names are taken from x@chromosome and SNP positions
from x@position. Packaged datasets ship with these slots empty;
fill them from the locus metrics first, as in the example. Loci with a
missing chromosome or a missing or zero position are ignored.
A chromosome is plotted when it carries at least min.snps
positioned SNPs and its last SNP lies at or beyond min.length
bp; the "length" used here and in the labels is the position of the
last SNP, not the assembly length. Chromosomes are ordered
alphabetically, numeric-aware (chr2 before chr10), with
the first name at the top of the plot. Every bin from the start of the
chromosome to its last SNP is drawn; bins containing no SNPs are
rendered in the lowest colour of the palette. The function does not
modify the input genlight object.
Value
A ggplot object (invisibly) displaying the SNP-density heat-map.
Author(s)
Author(s): Luis Mijangos. Custodian: Luis Mijangos – Post to https://groups.google.com/d/forum/dartr
See Also
Other graphics:
gl.colors(),
gl.map.interactive(),
gl.plot.heatmap(),
gl.select.colors(),
gl.select.shapes(),
gl.smearplot(),
gl.tree.nj()
Examples
t1 <- platypus.gl
t1$chromosome <- t1$other$loc.metrics$Chrom_Platypus_Chrom_NCBIv1
t1$position   <- t1$other$loc.metrics$ChromPos_Platypus_Chrom_NCBIv1
gl.plot.snp.density(t1,
                    bin.size   = 5e6,
                    min.snps   = 10,
                    min.length = 2e6,
                    plot.title = "Platypus SNP density")
Prints the history of a genlight object
Description
Prints the calls stored in the history of a genlight object
(x@other$history), one numbered entry per call, and returns them
as a table.
Usage
gl.print.history(x = NULL, history = NULL, verbose = NULL)
Arguments
x |
A genlight object with a history. Not needed when
|
history |
Either a history list (such as |
verbose |
Verbosity: 0, silent or fatal errors; 1, begin and end; 2, progress log; 3, progress and results summary; 5, full report [default 2, unless specified using gl.set.verbosity]. |
Details
dartR functions that modify a genlight object add the call that produced
it to x@other$history. This function lists those calls in order.
Each entry keeps its position in the history, also when only some entries
are selected with history. Calls longer than 80 characters are
wrapped, with continuation lines indented by two spaces.
To re-run the calls in a history, use gl.play.history.
Value
A data frame, returned invisibly, with one row per history entry:
nr, the position of the entry in the history, and history,
the call as text. The table is printed at verbose 1 or higher.
Author(s)
Author(s): Bernd Gruber. Custodian: Bernd Gruber (Post to https://groups.google.com/d/forum/dartr)
See Also
Other environment:
gl.check.verbosity(),
gl.check.wd(),
gl.recalc.metrics(),
gl.set.verbosity(),
gl.set.wd(),
theme_dartR()
Examples
gl2 <- gl.filter.callrate(testset.gl, method = "loc", threshold = 0.9)
gl3 <- gl.filter.callrate(gl2, method = "ind", threshold = 0.95)
gl.print.history(gl3)
gl.print.history(gl3, history = c(1, 3))
Calculates a similarity matrix for individuals based on the proportion of shared alleles
Description
This function calculates the proportion of shared alleles between each pair of individuals and returns it as a similarity matrix.
Usage
gl.propShared(x, verbose = NULL)
Arguments
x |
Name of the genlight object containing the SNP data [required]. |
verbose |
Verbosity: 0, silent or fatal errors; 1, begin and end; 2, brief progress messages; 3, progress and results summary; 5, full report [default 2, unless specified using gl.set.verbosity]. |
Details
At a locus, two diploid individuals with allele dosages g1 and g2 (0, 1 or 2) share 2 - |g1 - g2| of their two alleles. The similarity is the mean proportion of shared alleles over the loci called in both individuals, 1 - mean(|g1 - g2|) / 2, so missing data are handled pair by pair.
The similarity is the exact complement of
gl.dist.ind with method = "manhattan",
which this function uses for the calculation. Use
as.dist(1 - gl.propShared(x)) to obtain a distance.
Only SNP data are accepted: for SilicoDArT (presence/absence) data the division by two does not apply.
Value
A symmetric nInd(x) x nInd(x) similarity matrix with values between 0 (no alleles shared at any locus) and 1 (identical at all loci called in both individuals), and individual names as row and column names. The diagonal is set to 1. Pairs of individuals with no locus called in both get NA.
Author(s)
Author(s): Bernd Gruber. Custodian: Bernd Gruber – Post to https://groups.google.com/d/forum/dartr
See Also
Other distance:
gl.dist.ind(),
gl.dist.pop(),
gl.fst.pop(),
utils.dist.ind.snp()
Examples
res <- gl.propShared(bandicoot.gl)
res[1:5, 1:7] # show only a small part of the matrix
Randomly swaps the homozygote coding (0 and 2) in half of the loci
Description
This function samples half of the loci at random and, in the sampled loci, swaps the coding of the two homozygotes: 0 becomes 2 and 2 becomes 0. Heterozygotes (1) and missing values are unchanged. The allele labels of the sampled loci are reversed to match, so the object still describes the same genotypes; only which allele is counted changes.
Usage
gl.randomize.snps(
  x,
  plot.display = TRUE,
  plot.theme = theme_dartR(),
  plot.colors = NULL,
  plot.file = NULL,
  plot.dir = NULL,
  verbose = NULL
)
Arguments
x |
Name of the genlight object containing the SNP data [required]. |
plot.display |
If TRUE, resultant plots are displayed in the plot window [default TRUE]. |
plot.theme |
Theme for the plot. See Details for options [default theme_dartR()]. |
plot.colors |
Vector of four color names passed to
|
plot.file |
Name for the RDS binary file to save (base name only, exclude extension) [default NULL] |
plot.dir |
Directory in which to save the plot file [default as specified by the global working directory or tempdir()] |
verbose |
Verbosity: 0, silent or fatal errors; 1, begin and end; 2, progress log; 3, progress and results summary; 5, full report [default NULL, unless specified using gl.set.verbosity]. |
Details
DArT calls the most common allele as the reference allele. In a genlight object, homozygous for the reference allele are coded with a '0' and homozygous for the alternative allele are coded with a '2'. This causes some distortions in visuals from time to time. Only SNP data are accepted. FBM-backed objects are recoded in a copy of their backing file, so the input object is not modified. If plot.display = TRUE, two smear plots (pre-randomisation and post-randomisation) are presented using a random subset of individuals (10) and loci (100) to provide an overview of the changes. The combined plot is saved only when plot.file is specified.
Value
Returns a genlight object with half of the loci re-coded and their
allele labels (loc.all) reversed; the REF and ALT read counts and the
0/0 and 1/1 likelihoods in other$geno.metrics (see
gl.read.vcf) are swapped with them. Locus metric flags are
reset, as the
allele-frequency metrics no longer match the recoded genotypes.
Author(s)
Author(s): Luis Mijangos. Custodian: Luis Mijangos – Post to https://groups.google.com/d/forum/dartr
Examples
if (isTRUE(getOption("dartR_fbm"))) testset.gl <- gl.gen2fbm(testset.gl)
gl <- gl.filter.monomorphs(testset.gl)
res <- gl.randomize.snps(gl,verbose = 5)
Reads PLINK data file into a genlight object
Description
This function imports PLINK data into a genlight object and append available metadata.
Usage
gl.read.PLINK(
  filename,
  ind.metafile = NULL,
  loc.metafile = NULL,
  plink.cmd = "plink",
  plink.path = "path",
  fbm = FALSE,
  plink.flags = NULL,
  verbose = NULL
)
Arguments
filename |
Fully qualified path to PLINK input file (without including the extension) [required]. |
ind.metafile |
Name of the csv file containing the metrics for individuals [default NULL]. |
loc.metafile |
Name of the csv file containing the metrics for loci [default NULL]. |
plink.cmd |
The 'name' to call plink. This will depend on the file name (without the extension '.exe' if on windows) or the name of the PATH variable |
plink.path |
The path where the executable is. If plink is listed in the PATH then there is no need for this. This is what the option "path" means |
fbm |
Logical. If TRUE, the genotypes of the returned object are held
in a file-backed matrix (fbm) in its @fbm slot rather than in @gen. This
is useful for very large datasets that do not fit into RAM. A binary
fileset (.bed) is read in blocks of SNPs straight into the file-backed
matrix, so the genotypes are never held in memory as a whole; with
fbm = FALSE that matrix is converted to @gen in blocks of loci at the
end. A .ped is read into memory and converted when fbm = TRUE. Note that
using fbm objects requires the package bigsnpr to be installed. To back
convert use |
plink.flags |
additional parameters passed on to PLINK when a .ped
is converted with |
verbose |
Verbosity: 0, silent or fatal errors; 1, begin and end; 2, progress log; 3, progress and results summary; 5, full report [default NULL, adopting the global verbosity set by gl.set.verbosity(), or 2 if no global is set]. |
Details
This function handles either a binary fileset (.bed with its
.bim and .fam) or a text fileset (.ped, optionally with its .map). Both
are read in R; no PLINK executable is needed. Without a .map, loci are
named locus.1, locus.2, ... and chromosome and position are set to NA.
Loci are returned in file order (note that plink --make-bed sorts
loci by chromosome and position, so a .ped read directly and the .bed
PLINK writes from it can differ in locus order). PLINK's chromosome code
0 (unmapped) is returned as NA on both routes.
The only case that still calls PLINK is when plink.flags is given:
the .ped/.map are then converted with plink --make-bed and those
flags in a temporary directory, so no files are written into the input
directory.
Genotypes are coded as the count of allele.2 (column 6 of the
.bim file, the major allele under PLINK 1.x defaults): 0 = homozygous
allele.1, 2 = homozygous allele.2. The alleles are stored
as "allele.1/allele.2" (see alleles()), so the counted
allele is the second one, as for every dartR object; a missing allele
(PLINK code 0, e.g. for a monomorphic locus) is written as 0. Note that
this is the
opposite orientation to gl.read.vcf, which counts the ALT
allele.
Additional metadata can be included passing .csv files. These will be appended to the existing metadata present in the PLINK files.
The locus metadata needs to be in a csv file with headings, with a mandatory column headed AlleleID corresponding exactly to the locus identity labels provided with the SNP data.
The individual metadata needs a mandatory column headed id whose entries match the individual labels in the PLINK .fam file; rows are matched to individuals by id, so their order in the file does not matter. If a pop column is present it is used to assign populations.
Value
A genlight object with the SNP data and associated metadata included.
Author(s)
Author(s): Carlo Pacioni. Custodian: Carlo Pacioni – Post to https://groups.google.com/d/forum/dartr
See Also
Other io:
gl.load(),
gl.read.csv(),
gl.read.dart(),
gl.read.fasta(),
gl.read.silicodart(),
gl.save(),
gl.write.csv(),
utils.read.dart()
Examples
# Create a small PLINK binary fileset (4 individuals x 4 SNPs) and read it
base <- file.path(tempdir(), "toy")
writeLines(c("1\tsnp1\t0\t100\tG\tA", "1\tsnp2\t0\t200\tT\tG",
             "2\tsnp3\t0\t150\tA\tC", "2\tsnp4\t0\t300\tC\tT"),
           paste0(base, ".bim"))
writeLines(c("FAM1 ind1 0 0 1 1", "FAM1 ind2 0 0 2 1",
             "FAM2 ind3 0 0 1 2", "FAM2 ind4 0 0 2 2"),
           paste0(base, ".fam"))
writeBin(as.raw(c(0x6c, 0x1b, 0x01, 0xcb, 0x2f, 0xab, 0xb7)),
         paste0(base, ".bed"))
gl <- gl.read.PLINK(base, verbose = 0)
as.matrix(gl)
Reads SNP data from a csv file into a genlight object
Description
This script takes SNP genotypes from a csv file, combines them with individual and locus metrics and creates a genlight object.
The SNP data need to be in one of two forms. SNPs can be coded 0 for homozygous reference, 2 for homozygous alternate, 1 for heterozygous, and NA for missing values; or the SNP data can be coded A/A, A/C, C/T, G/A etc, and -/- for missing data. In this format, the reference allele is the most frequent allele, as used by DArT. Other formats will throw an error.
The SNP data need to be individuals as rows, labeled, and loci as columns, also labeled. If the orientation is individuals as columns and loci by rows, then set transpose=TRUE.
The individual metrics need to be in a csv file, with headings, with a mandatory id column corresponding exactly to the individual identity labels provided with the SNP data and in the same order.
The locus metadata needs to be in a csv file with headings, with a mandatory column headed AlleleID corresponding exactly to the locus identity labels provided with the SNP data and in the same order.
Note that the locus metadata will be complemented by calculable statistics corresponding to those that would be provided by Diversity Arrays Technology (e.g. CallRate).
Usage
gl.read.csv(
  filename,
  transpose = FALSE,
  ind.metafile = NULL,
  loc.metafile = NULL,
  fbm = FALSE,
  verbose = NULL
)
Arguments
filename |
Name of the csv file containing the SNP genotypes [required]. |
transpose |
If TRUE, rows are loci and columns are individuals [default FALSE]. |
ind.metafile |
Name of the csv file containing the metrics for individuals [optional]. |
loc.metafile |
Name of the csv file containing the metrics for loci [optional]. |
fbm |
If TRUE, the genlight object is converted to a file-backed format. This is useful for very large datasets. To back convert use: gl.fbm2gen(). |
verbose |
Verbosity: 0, silent or fatal errors; 1, begin and end; 2, progress log; 3, progress and results summary; 5, full report [default 2 or as specified using gl.set.verbosity]. |
Value
A genlight object with the SNP data and associated metadata included.
Author(s)
Author(s): Luis Mijangos. Custodian: Luis Mijangos – Post to https://groups.google.com/d/forum/dartr
See Also
Other io:
gl.load(),
gl.read.PLINK(),
gl.read.dart(),
gl.read.fasta(),
gl.read.silicodart(),
gl.save(),
gl.write.csv(),
utils.read.dart()
Examples
csv_file <- system.file('extdata','platy_test.csv', package='dartR.data')
ind_metadata <- system.file('extdata','platy_ind.csv', package='dartR.data')
gl  <- gl.read.csv(filename = csv_file, ind.metafile = ind_metadata)
Imports DArT data into dartR and converts it into a dartR genlight object
Description
This function is a wrapper function that allows you to convert your DArT file into a genlight object of class dartR.
Usage
gl.read.dart(
  filename,
  ind.metafile = NULL,
  fbm = FALSE,
  recalc = TRUE,
  mono.rm = FALSE,
  nas = "-",
  topskip = NULL,
  lastmetric = NULL,
  covfilename = NULL,
  service.row = 1,
  plate.row = 3,
  probar = FALSE,
  verbose = NULL
)
Arguments
filename |
File containing the SNP data (csv file) [required]. |
ind.metafile |
File that contains additional information on individuals [required]. |
fbm |
If TRUE, the genotypes of the returned object are held in a
file-backed matrix (@fbm), which suits large datasets. The genotype
columns of the report are read in chunks of rows straight into a
file-backed matrix, so they are never held in memory as a whole; with
fbm = FALSE that matrix is converted to @gen in blocks of loci at the end
[default FALSE].
If you want to back convert use |
recalc |
If TRUE, force the recalculation of locus metrics [default TRUE]. |
mono.rm |
If TRUE, force the removal of monomorphic loci (including all NAs. [default FALSE]. |
nas |
A character specifying NAs [default '-']. |
topskip |
A number specifying the number of initial rows to be skipped [default NULL]. |
lastmetric |
Deprecated, specifies the last column of locus metadata. Can be specified as a column number [default NULL]. |
covfilename |
Deprecated, sse ind.metafile parameter [NULL]. |
service.row |
The row number for the DArT service is contained [default 1]. |
plate.row |
The row number the plate well [default 3]. |
probar |
Show progress bar [default FALSE]. |
verbose |
Verbosity: 0, silent or fatal errors; 1, begin and end; 2, progress log ; 3, progress and results summary; 5, full report [default 2, or as set by gl.set.verbose()]. |
Details
The function will determine automatically if the data are in Diversity Arrays one-row csv format or two-row csv format.
The first row of data is determined from the number of rows with an * in the first column. This can be alternatively specified with the topskip parameter.
The DArT service code is added to the ind.metrics of the genlight object. The row containing the service code for each individual can be specified with the service.row parameter.
The DArT plate well is added to the ind.metrics of the genlight object. The row containing the plate well for each individual can be specified with the plate.row parameter.
If individuals have been deleted from the input file manually, then the locus metrics supplied by DArT will no longer be correct and some loci may be monomorphic. To accommodate this, set mono.rm and recalc to TRUE.
Value
A dartR genlight object that contains individual and locus metrics [if data were provided] and locus metrics [from a DArT report].
Author(s)
Author(s): Bernd Gruber. Custodian: Bernd Gruber (Post to https://groups.google.com/d/forum/dartr)
See Also
Other io:
gl.load(),
gl.read.PLINK(),
gl.read.csv(),
gl.read.fasta(),
gl.read.silicodart(),
gl.save(),
gl.write.csv(),
utils.read.dart()
Examples
dartfile <- system.file('extdata','testset_SNPs_2Row.csv', package='dartR.data')
metadata <- system.file('extdata','testset_metadata.csv', package='dartR.data')
gl <- gl.read.dart(dartfile, ind.metafile = metadata, probar=TRUE)
gl <- gl.read.dart(dartfile, ind.metafile = metadata, fbm=TRUE)
Reads FASTA files and converts them to genlight object
Description
The following IUPAC Ambiguity Codes are taken as heterozygotes:
M is heterozygote for AC and CA
R is heterozygote for AG and GA
W is heterozygote for AT and TA
S is heterozygote for CG and GC
Y is heterozygote for CT and TC
K is heterozygote for GT and TG
The following IUPAC Ambiguity Codes are taken as missing data:
V
H
D
B
N
The function can deal with missing data in individuals, e.g. when FASTA files have different number of individuals due to missing data. The allele with the highest frequency is taken as the reference allele. SNPs with more than two alleles are skipped.
Usage
gl.read.fasta(
  fasta.files,
  parallel = FALSE,
  n.cores = NULL,
  fbm = FALSE,
  verbose = NULL
)
Arguments
fasta.files |
Fasta files to read [required]. |
parallel |
A logical indicating whether multiple cores -if available- should be used for the computations (TRUE), or not (FALSE); requires the package parallel to be installed [default FALSE]. |
n.cores |
If parallel is TRUE, the number of cores to be used in the computations; if NULL, then the maximum number of cores available on the computer is used [default NULL]. |
fbm |
Logical. If TRUE, the returned genlight object will contain a
file-backed matrix (fbm) in its @genome slot. This is useful for very
large datasets that do not fit into RAM. Note that using fbm objects
requires the package bigsnpr to be installed. [default FALSE]. to back convert
use |
verbose |
Verbosity: 0, silent or fatal errors; 1, begin and end; 2, progress log; 3, progress and results summary; 5, full report [default 2, unless specified using gl.set.verbosity]. |
Details
Ambiguity characters are often used to code heterozygotes. However, using heterozygotes as ambiguity characters may bias many estimates. See more information in the link below: https://evodify.com/heterozygotes-ambiguity-characters/
Each record in a FASTA file must occupy exactly two lines: a '>' header line followed by the full sequence on a single line. Line-wrapped (multi-line) FASTA is not supported and is rejected with an error.
Value
A genlight object.
Author(s)
Author(s): Luis Mijangos. Custodian: Luis Mijangos – Post to https://groups.google.com/d/forum/dartr
See Also
Other io:
gl.load(),
gl.read.PLINK(),
gl.read.csv(),
gl.read.dart(),
gl.read.silicodart(),
gl.save(),
gl.write.csv(),
utils.read.dart()
Examples
# Folder where the fasta files are located.
folder_samples <- system.file('extdata', package ='dartR.data')
# listing the FASTA files, including their path. Files have an extension
# that contains "fas".
file_names <- list.files(path = folder_samples, pattern = "*.fas",
full.names = TRUE)
# reading fasta files
obj <- gl.read.fasta(file_names)
Imports presence/absence data from SilicoDArT to genlight {agegenet} format (ploidy=1)
Description
DaRT provide the data as a matrix of entities (individual animals) across the top and attributes (P/A of sequenced fragment) down the side in a format that is unique to DArT. This program reads the data in to adegenet format for consistency with other programming activity. The script may require modification as DArT modify their data formats from time to time.
Usage
gl.read.silicodart(
  filename,
  ind.metafile = NULL,
  nas = "-",
  topskip = NULL,
  lastmetric = "Reproducibility",
  probar = TRUE,
  verbose = NULL
)
Arguments
filename |
Name of csv file containing the SilicoDArT data [required]. |
ind.metafile |
Name of csv file containing metadata assigned to each entity (individual) [default NULL]. |
nas |
Missing data character [default '-']. |
topskip |
Number of rows to skip before the header row (containing the specimen identities) [optional]. |
lastmetric |
Specifies the last non genetic column (Default is 'Reproducibility'). Be sure to check if that is true, otherwise the number of individuals will not match. You can also specify the last column by a number [default "Reproducibility"]. |
probar |
Show progress bar [default TRUE]. |
verbose |
Verbosity: 0, silent or fatal errors; 1, begin and end; 2, progress log; 3, progress and results summary; 5, full report [default 2, or as set by gl.set.verbose()]. |
Details
gl.read.silicodart() opens the data file (csv comma delimited) and skips the first n=topskip lines. The script assumes that the next line contains the entity labels (specimen ids) followed immediately by the SNP data for the first locus. It reads the presence/absence data into a matrix of 1s and 0s, and inputs the locus metadata and specimen metadata. The locus metadata comprises a series of columns of values for each locus including the essential columns of CloneID and the desirable variables Reproducibility and PIC. Refer to documentation provide by DArT for an explanation of these columns. The specimen metadata provides the opportunity to reassign specimens to populations, and to add other data relevant to the specimen. The key variables are id (specimen identity which must be the same and in the same order as the SilicoDArT file, each unique), pop (population assignment), lat (latitude, optional) and lon (longitude, optional). id, pop, lat, lon are the column headers in the csv file. Other optional columns can be added. The data matrix, locus names (forced to be unique), locus metadata, specimen names, specimen metadata are combined into a genind object. Refer to the documentation for {adegenet} for further details.
Value
An object of class genlight with ploidy set to 1, containing
the presence/absence data, and locus and individual metadata.
Author(s)
Author(s): Bernd Gruber. Custodian: Bernd Gruber – Post to https://groups.google.com/d/forum/dartr
See Also
Other io:
gl.load(),
gl.read.PLINK(),
gl.read.csv(),
gl.read.dart(),
gl.read.fasta(),
gl.save(),
gl.write.csv(),
utils.read.dart()
Examples
silicodartfile <- system.file('extdata','testset_SilicoDArT.csv', package='dartR.data')
metadata <- system.file('extdata',ind.metafile ='testset_metadata_silicodart.csv',
package='dartR.data')
testset.gs <- gl.read.silicodart(filename = silicodartfile, ind.metafile = metadata)
Converts a vcf file into a genlight object
Description
This function needs package vcfR, please install it.
Usage
gl.read.vcf(
  vcffile,
  ind.metafile = NULL,
  mode = "genotype",
  fbm = FALSE,
  read.counts = FALSE,
  likelihoods = FALSE,
  verbose = NULL,
  parser = "vcfR"
)
Arguments
vcffile |
A vcf file (works only for diploid data) [required]. |
ind.metafile |
Optional file in csv format with metadata for each individual (see details for explanation) [default NULL]. |
mode |
"genotype" all heterozygous sites will be coded as 1 regardless ploidy level, dosage: sites will be codes as copy number of alternate allele [default genotype] |
fbm |
Logical, if TRUE the dartR object will contain a file-backed matrix. this is important for large data sets that do not fit into RAM. |
read.counts |
Logical, if TRUE the reference and alternative read counts of each genotype are stored in the dartR object (see details). They take much more memory than the genotypes [default FALSE]. |
likelihoods |
Logical, if TRUE the likelihoods of the three genotypes (FORMAT PL, or GL) of each genotype call are stored in the dartR object (see details). Only in "genotype" mode. They take 12 bytes per genotype, about 190 MB for 171 individuals and 93,000 loci [default FALSE]. |
verbose |
Verbosity: 0, silent or fatal errors; 1, begin and end; 2, progress log; 3, progress and results summary; 5, full report [default 2, unless specified using gl.set.verbosity]. |
parser |
"vcfR" reads the vcf with package vcfR (the whole file is
held in memory as text); "cpp" reads the genotypes with the C++ parser of
package tidypopgen, chunk by chunk straight into a file-backed matrix,
which is much faster and needs little memory for large files. tidypopgen
is not installed with dartR.base; install it with
|
Details
The ind.metadata file needs to have very specific headings. First a heading called id. Here the ids have to match the ids in the dartR object. The following column headings are optional. pop: specifies the population membership of each individual. lat and lon specify spatial coordinates (in decimal degrees WGS1984 format). Additional columns with individual metadata can be imported (e.g. age, gender). Individuals in the SNP data that are absent from the ind.metafile are retained in the returned object with NA metadata; a warning lists them at verbose >= 1.
Genotypes are coded as the count of the ALT allele: 0 = homozygous
REF, 2 (or the copy number in dosage mode) = homozygous ALT. Note that
this is the opposite orientation to gl.read.PLINK, which
counts allele.2 (the PLINK 1.x major allele).
In "genotype" mode the returned object is coded as diploid; if the vcf contains haploid or polyploid genotype calls a warning is issued at verbose >= 1 (haploid calls are recoded as diploid homozygotes, polyploid heterozygous calls as 1). In "dosage" mode the ploidy of the object is set to the data's maximum copy number of the alternate allele, uniform across individuals. Note also that this function checks to see if there are input of mode, missing input of mode will issue the user with an error. Please carefully check the data if "dosage" mode is used.
When the vcf holds FORMAT DP, the mean read depth of each locus over its
called genotypes is stored in x@other$loc.metrics$rdepth, where
gl.report.rdepth and gl.filter.rdepth find it.
Missing and half-missing calls (e.g. ./., 0/.) are not counted; some
callers report a depth of 0 for them.
With read.counts = TRUE, x@other$geno.metrics holds two
integer matrices of individuals x loci: ref.count and
alt.count, the reads of the REF and ALT allele of each genotype.
They are read from FORMAT AD or, for genotypes without AD, from FORMAT
BSDP (read counts of the bases A, C, G and T) at the REF and ALT bases.
Counts are stored as the vcf reports them, also for uncalled genotypes.
With likelihoods = TRUE, x@other$geno.metrics also holds
pl.ref, pl.het and pl.alt: the phred-scaled
likelihoods of 0/0, 0/1 and 1/1 for each genotype, as integer matrices of
individuals x loci. They are read from FORMAT PL or, for genotypes without
PL, from FORMAT GL as round(-10 * GL). Each genotype's likelihoods are
shifted so that the most likely genotype has 0, as some callers write PL
whose lowest value is above 0; likelihoods are defined only up to a
constant, so nothing is lost. A likelihood of 0 (GL of -inf) is stored as
the largest integer. Genotypes whose likelihoods are missing, do not
number three (haploid or polyploid calls) or are all equal (e.g.
./.:0,0,0) get NA; uncalled genotypes with informative likelihoods keep
them. Likelihoods are not stored in "dosage" mode.
The matrices in x@other$geno.metrics have no row or column names:
row i belongs to indNames(x)[i] and column j to
locNames(x)[j], so renaming individuals or loci cannot leave stale
names on them. The matrices follow the genotypes when individuals or loci
are subset, sorted or combined, and gl.randomize.snps swaps
the REF and ALT read counts and the 0/0 and 1/1 likelihoods of the loci it
recodes; gl.compliance.check removes them if their
dimensions no longer match the object.
With parser = "cpp" (package tidypopgen) the genotypes are read
by tidypopgen's C++ parser into a file-backed matrix and copied in blocks
of loci into the returned object (file-backed with fbm = TRUE,
converted to @gen in blocks otherwise); the fixed columns of the vcf
(CHROM to INFO) are read in chunks as well, so the whole file is never
held in memory. For the variants it reads, the result is the same as with
parser = "vcfR": genotypes (count of the ALT allele), locus names,
alleles, chromosome, position and the QUAL, FILTER and INFO locus
metrics. Limits: only single-base (SNP) variants are read, so indels are
skipped (with a warning); only mode = "genotype"; no rdepth, read
counts or likelihoods; and only diploid genotype calls – a vcf with
haploid or polyploid calls (e.g. a sex chromosome in the heterogametic
sex) stops with an error, as tidypopgen would code a haploid call like a
heterozygote. Use parser = "vcfR" in these cases.
Value
A genlight object.
Author(s)
Author(s): Bernd Gruber, Ching Ching Lau. Custodian: Bernd Gruber (Post to https://groups.google.com/d/forum/dartr)
Examples
## Not run:
# read in vcf and convert to format as DArT data
obj <- gl.read.vcf(system.file('extdata/test.vcf',package='dartR'),
ind.metafile="metafile.csv")
# read in vcf and convert to format as dosage
obj <- gl.read.vcf(system.file('extdata/test.vcf',package='dartR'),
ind.metafile="metafile.csv",mode="dosage")

## End(Not run)
Reassign specified individuals to a (new or existing) population
Description
Reassigns a specified set of individuals from their current populations to a new population label, which may or may not already exist in the genlight {adegenet} object.
This function is useful when you want to manually override the population membership of a subset of individuals, for example to combine individuals from several small populations into a single larger one, or to pull a few misassigned individuals into a corrected population.
The function returns a genlight object with updated population assignments for the specified individuals. All other individuals retain their original population assignments.
Usage
gl.reassign.ind(x, ind.list, new.pop, verbose = NULL)
Arguments
x |
Name of the genlight object containing SNP genotypes [required]. |
ind.list |
Vector specifying individuals to be reassigned. Can be a
character vector of individual names (matching |
new.pop |
Character string giving the population label to which the
specified individuals will be reassigned. This value may or may not
already exist as an entry in |
verbose |
Verbosity: 0, silent or fatal errors; 1, begin and end; 2,
progress log; 3, progress and results summary; 5, full report
[default 2 or as specified using |
Value
A genlight object with the specified individuals reassigned to the new population.
Author(s)
Author(s): Arthur Georges. Custodian: Arthur Georges – Post to https://groups.google.com/d/forum/dartr
See Also
Other data manipulation:
gl.add.indmetrics(),
gl.define.pop(),
gl.drop.ind(),
gl.drop.loc(),
gl.drop.pop(),
gl.edit.recode.pop(),
gl.fbm.cleanup(),
gl.fbm2gen(),
gl.gen2fbm(),
gl.impute(),
gl.join(),
gl.keep.ind(),
gl.keep.loc(),
gl.keep.pop(),
gl.make.recode.ind(),
gl.make.recode.pop(),
gl.merge.pop(),
gl.reassign.pop(),
gl.recode.ind(),
gl.recode.pop(),
gl.rename.pop(),
gl.sample(),
gl.sim.genotypes(),
gl.sort(),
gl.subsample.ind(),
gl.subsample.loc(),
gl.subsample.loci()
Examples
  # SNP data
  popNames(testset.gl)
  indNames(testset.gl)[1:5]
  gl2 <- gl.reassign.ind(
    testset.gl,
    ind.list = indNames(testset.gl)[1:5],
    new.pop  = "NewGroup",
    verbose  = 3
  )
  popNames(gl2)

  # Tag P/A data
  popNames(testset.gs)
  gs2 <- gl.reassign.ind(
    testset.gs,
    ind.list = 1:10,
    new.pop  = "Reassigned",
    verbose  = 3
  )
  popNames(gs2)
Assigns an individual attribute in ind.metrics as pop in a genlight {adegenet} object
Description
Individuals are assigned to populations based on the individual/sample/specimen metrics file (csv) used with gl.read.dart(). One might want to define the population structure in accordance with another classification, such as using an individual metric (e.g. sex, male or female). This script discards the current population assignments and replaces them with new population assignments defined by a specified individual metric. The function returns a genlight object with the new population assignments. Note that the original population assignments are lost.
Usage
gl.reassign.pop(x, as.pop, verbose = NULL)
Arguments
x |
Name of the genlight object containing SNP or SilicoDArT data [required]. |
as.pop |
Specify the name of the individual metric to set as the pop variable [required]. |
verbose |
Verbosity: 0, silent or fatal errors; 1, begin and end; 2, progress log; 3, progress and results summary; 5, full report [default 2 or as specified using gl.set.verbosity]. |
Value
A genlight object with the reassigned populations.
Author(s)
Author(s): Arthur Georges. Custodian: Arthur Georges – Post to https://groups.google.com/d/forum/dartr
See Also
Other data manipulation:
gl.add.indmetrics(),
gl.define.pop(),
gl.drop.ind(),
gl.drop.loc(),
gl.drop.pop(),
gl.edit.recode.pop(),
gl.fbm.cleanup(),
gl.fbm2gen(),
gl.gen2fbm(),
gl.impute(),
gl.join(),
gl.keep.ind(),
gl.keep.loc(),
gl.keep.pop(),
gl.make.recode.ind(),
gl.make.recode.pop(),
gl.merge.pop(),
gl.reassign.ind(),
gl.recode.ind(),
gl.recode.pop(),
gl.rename.pop(),
gl.sample(),
gl.sim.genotypes(),
gl.sort(),
gl.subsample.ind(),
gl.subsample.loc(),
gl.subsample.loci()
Examples
# SNP data
if (isTRUE(getOption("dartR_fbm"))) testset.gl <- gl.gen2fbm(testset.gl)
   popNames(testset.gl)
   gl <- gl.reassign.pop(testset.gl, as.pop='sex',verbose=3)
   popNames(gl)
# Tag P/A data
   popNames(testset.gs)
   gs <- gl.reassign.pop(testset.gs, as.pop='sex',verbose=3)
   popNames(gs)
Recalculates locus metrics when individuals or populations are deleted from a genlight {adegenet} object
Description
When individuals, or populations, are deleted from a genlight object, the locus metrics no longer apply. For example, the Call Rate may be different considering the subset of individuals, compared with the full set. This script recalculates those affected locus metrics. For SNP data these are AvgPIC, CallRate, FreqHets, FreqHomRef, FreqHomSnp, OneRatioRef, OneRatioSnp, PICRef, PICSnp and maf. For SilicoDArT (tag presence/absence) data they are CallRate, OneRatio and PIC.
Usage
gl.recalc.metrics(x, mono.rm = FALSE, verbose = NULL)
Arguments
x |
Name of the genlight object containing SNP or presence/absence (SilicoDArT) data [required]. |
mono.rm |
If TRUE, removes monomorphic loci [default FALSE]. |
verbose |
Verbosity: 0, silent or fatal errors; 1, begin and end; 2, progress log; 3, progress and results summary; 5, full report [default NULL, adopting the global verbosity set by gl.set.verbosity(), or 2 if no global is set]. |
Details
The script optionally removes resultant monomorphic loci or loci
with all values missing and deletes them (using gl.filter.monomorphs).
The script returns a genlight object with the recalculated locus metadata.
Metrics that are not recalculated fall into two groups. Some are unaffected
by the removal of individuals and are correctly left as they are: RepAvg,
TrimmedSequence, AlleleSequence, SNP, SnpPosition, clone and uid for SNP
data; Qpmr and Reproducibility for SilicoDArT data. Others are affected by
the removal of individuals but cannot be recovered from the genotypes,
because they derive from raw read counts that a genlight object does not
carry: rdepth, AvgCountRef and AvgCountSnp for SNP data; AvgReadDepth and
StDevReadDepth for SilicoDArT data. These keep the values read from the DArT
file, and can therefore be inconsistent with the recalculated metrics.
Precondition on the locus metrics: the function requires
x@other$loc.metrics to be a data frame with one row per locus, the
structure that gl.read.dart and gl.compliance.check produce. If the slot is
absent or is not a data frame, as in a genlight object assembled by hand, an
empty data frame with one row per locus is created to receive the metrics
and a message states that the DArT metadata is not present. If the slot is a
data frame whose row count does not match the number of loci, the object is
not repairable here and the function stops.
Monomorphic loci: the monomorphs flag records whether the object is known to
be free of monomorphic loci. With mono.rm = FALSE the flag is set from a
check made on the metrics just recalculated, so it never reports a state
that was not examined. With mono.rm = TRUE the loci are removed and the flag
is set by gl.filter.monomorphs; if every locus is monomorphic or scored all
NA, none can be removed, and the function reports that condition and
completes with the flag FALSE.
Messages: the utils.recalc.* helpers are called with verbose = 0 and this
function reports on their behalf, so one call produces one set of progress
messages rather than one set per helper.
History: gl.recalc.metrics is an implementation step of many other
dartRverse functions. An entry is appended to x@other$history only
when the function is called directly. A call made from inside another
dartRverse function appends nothing, so the history records the calls the
user made rather than the steps beneath them.
Value
A genlight object with the recalculated locus metadata.
Author(s)
Author(s): Luis Mijangos. Custodian: Luis Mijangos – Post to https://groups.google.com/d/forum/dartr
See Also
Other environment:
gl.check.verbosity(),
gl.check.wd(),
gl.print.history(),
gl.set.verbosity(),
gl.set.wd(),
theme_dartR()
Examples
if (isTRUE(getOption("dartR_fbm"))) testset.gl <- gl.gen2fbm(testset.gl)
  gl <- gl.recalc.metrics(testset.gl, verbose=2)
Recodes individual (=specimen = sample) labels in a genlight object
Description
This function recodes individual labels and/or deletes individuals from a DaRT genlight SNP file based on a lookup table provided as a csv file.
Usage
gl.recode.ind(x, ind.recode, recalc = FALSE, mono.rm = FALSE, verbose = NULL)
Arguments
x |
Name of the genlight object [required]. |
ind.recode |
Name of the csv file containing the individual relabelling [required]. |
recalc |
If TRUE, recalculate the locus metadata statistics if any individuals are deleted in the filtering [default FALSE]. |
mono.rm |
If TRUE, remove monomorphic loci [default FALSE]. |
verbose |
Verbosity: 0, silent or fatal errors; 1, begin and end; 2, progress log; 3, progress and results summary; 5, full report [default NULL, adopting the global verbosity set by gl.set.verbosity(), or 2 if no global is set]. |
Details
Renaming individuals may be required when there have been errors in labeling arising in the process from sample to sequence files. There may be occasions where renaming individuals is required for preparation of figures. When caution needs to be exercised because of the potential for breaking the 'chain of evidence' associated with the samples, recoding individuals using a recode table (csv) can provide a durable record of the changes. The function works with genlight objects containing SNP genotypes and Tag P/A data (SilicoDArT). For SNP genotype data, the function, having deleted individuals, optionally identifies resultant monomorphic loci or loci with all values missing and deletes them. The script also optionally recalculates the locus metadata as appropriate. The optional deletion of monomorphic loci and the optional recalculation of locus statistics is not available for Tag P/A data (SilicoDArT). The script returns a dartR genlight object with the new individual names and the recalculated locus metadata.
Value
A genlight object with the recoded and reduced data.
Author(s)
Author(s): Arthur Georges. Custodian: Arthur Georges – Post to https://groups.google.com/d/forum/dartr
See Also
gl.filter.monomorphs for filtering monomorphs,
gl.recalc.metrics for recalculating locus metrics,
gl.recode.pop for recoding populations
Other data manipulation:
gl.add.indmetrics(),
gl.define.pop(),
gl.drop.ind(),
gl.drop.loc(),
gl.drop.pop(),
gl.edit.recode.pop(),
gl.fbm.cleanup(),
gl.fbm2gen(),
gl.gen2fbm(),
gl.impute(),
gl.join(),
gl.keep.ind(),
gl.keep.loc(),
gl.keep.pop(),
gl.make.recode.ind(),
gl.make.recode.pop(),
gl.merge.pop(),
gl.reassign.ind(),
gl.reassign.pop(),
gl.recode.pop(),
gl.rename.pop(),
gl.sample(),
gl.sim.genotypes(),
gl.sort(),
gl.subsample.ind(),
gl.subsample.loc(),
gl.subsample.loci()
Examples
  file <- system.file('extdata','testset_ind_recode.csv', package='dartR.data')
  if (isTRUE(getOption("dartR_fbm"))) testset.gl <- gl.gen2fbm(testset.gl)
  gl <- gl.recode.ind(testset.gl, ind.recode=file, verbose=3)
Recodes population assignments in a genlight object
Description
This function recodes population assignments and/or deletes populations from a DaRT genlight object based on information provided in a csv population recode file.
Usage
gl.recode.pop(x, pop.recode, recalc = FALSE, mono.rm = FALSE, verbose = NULL)
Arguments
x |
Name of the genlight object [required]. |
pop.recode |
Name of the csv file containing the population reassignments [required]. |
recalc |
If TRUE, recalculates the locus metadata statistics if any individuals are deleted in the filtering [default FALSE]. |
mono.rm |
If TRUE, removes monomorphic loci [default FALSE]. |
verbose |
Verbosity: 0, silent or fatal errors; 1, begin and end; 2, progress log; 3, progress and results summary; 5, full report [default NULL, adopting the global verbosity set by gl.set.verbosity(), or 2 if no global is set]. |
Details
Individuals are assigned to populations based on the specimen metadata data file (csv) used with gl.read.dart(). Recoding can be used to amalgamate populations or to selectively delete or retain populations. When caution needs to be exercised because of the potential for breaking the 'chain of evidence' associated with the samples, recoding individuals using a recode table (csv) can provide a durable record of the changes. The population recode file contains a list of populations taken from the genlight object as the first column of the csv file, and the new population assignments are located in the second column of the csv file. The keyword 'Delete' used as a new population assignment will result in the associated specimen being dropped from the dataset. The function works with genlight objects containing SNP genotypes and Tag P/A data (SilicoDArT). For SNP genotype data, the function, having deleted populations, optionally identifies resultant monomorphic loci or loci with all values missing and deletes them. The script also optionally recalculates the locus metadata as appropriate. The optional deletion of monomorphic loci and the optional recalculation of locus statistics is not available for Tag P/A data (SilicoDArT).
Value
A genlight object with the recoded and reduced data.
Author(s)
Author(s): Arthur Georges. Custodian: Arthur Georges – Post to https://groups.google.com/d/forum/dartr
See Also
gl.recode.ind, gl.drop.pop,
gl.filter.monomorphs
Other data manipulation:
gl.add.indmetrics(),
gl.define.pop(),
gl.drop.ind(),
gl.drop.loc(),
gl.drop.pop(),
gl.edit.recode.pop(),
gl.fbm.cleanup(),
gl.fbm2gen(),
gl.gen2fbm(),
gl.impute(),
gl.join(),
gl.keep.ind(),
gl.keep.loc(),
gl.keep.pop(),
gl.make.recode.ind(),
gl.make.recode.pop(),
gl.merge.pop(),
gl.reassign.ind(),
gl.reassign.pop(),
gl.recode.ind(),
gl.rename.pop(),
gl.sample(),
gl.sim.genotypes(),
gl.sort(),
gl.subsample.ind(),
gl.subsample.loc(),
gl.subsample.loci()
Examples
  mfile <- system.file('extdata', 'testset_pop_recode.csv', package='dartR.data')
  nPop(testset.gl)
  if (isTRUE(getOption("dartR_fbm"))) testset.gl <- gl.gen2fbm(testset.gl)
  gl <- gl.recode.pop(testset.gl, pop.recode=mfile, verbose=3)
Renames a population in a genlight object
Description
This script renames a nominated population in a genlight object.
Usage
gl.rename.pop(x, old = NULL, new = NULL, verbose = NULL)
Arguments
x |
Name of the genlight object containing SNP genotypes or Tag P/A data (SilicoDArT) [required]. |
old |
Name of population to be changed [required]. |
new |
New name for the population [required]. |
verbose |
Verbosity: 0, silent or fatal errors; 1, begin and end; 2, progress log; 3, progress and results summary; 5, full report [default NULL, adopting the global verbosity set by gl.set.verbosity(), or 2 if no global is set]. |
Details
Individuals are assigned to populations based on the specimen metadata data file (csv) used with gl.read.dart().
The nominated population must exist in the genlight object, and the new
name must not already be in use — renaming to an existing population name
is a fatal error, to guard against inadvertently merging populations. To
amalgamate populations, use gl.recode.pop.
The script returns a genlight object with the new population name.
Value
A genlight object with the new population name.
Author(s)
Author(s): Arthur Georges. Custodian: Arthur Georges – Post to https://groups.google.com/d/forum/dartr
See Also
gl.recode.pop for bulk recoding or amalgamating
populations
Other data manipulation:
gl.add.indmetrics(),
gl.define.pop(),
gl.drop.ind(),
gl.drop.loc(),
gl.drop.pop(),
gl.edit.recode.pop(),
gl.fbm.cleanup(),
gl.fbm2gen(),
gl.gen2fbm(),
gl.impute(),
gl.join(),
gl.keep.ind(),
gl.keep.loc(),
gl.keep.pop(),
gl.make.recode.ind(),
gl.make.recode.pop(),
gl.merge.pop(),
gl.reassign.ind(),
gl.reassign.pop(),
gl.recode.ind(),
gl.recode.pop(),
gl.sample(),
gl.sim.genotypes(),
gl.sort(),
gl.subsample.ind(),
gl.subsample.loc(),
gl.subsample.loci()
Examples
if (isTRUE(getOption("dartR_fbm"))) testset.gl <- gl.gen2fbm(testset.gl)
   gl <- gl.rename.pop(testset.gl, old='EmsubRopeMata', new='Outgroup')
Reports allelic richness per population from a genlight object
Description
This function calculates allelic richness across populations for SNP data in a genlight object, using a rarefaction-based approach adapted from El Mousadik and Petit (1996). By standardizing the expected number of distinct alleles to a fixed sample size, it allows meaningful comparisons among populations with different sampling depths. Because allelic richness captures the contribution of rare alleles more effectively than heterozygosity-based indices, it can better reveal subtle patterns of genetic diversity, especially in conservation contexts where low-frequency alleles may hold particular importance. Optional bootstrapping is provided to generate measures of uncertainty such as confidence intervals, standard error, or standard deviation.
Usage
gl.report.allelerich(
  x,
  nboots = 0,
  boot.method = "loc",
  conf = 0.95,
  CI.type = "bca",
  plot.display = TRUE,
  plot.theme = theme_dartR(),
  plot.colors.pop = gl.colors("dis", verbose = 0),
  plot.dir = NULL,
  plot.file = NULL,
  error.bar = "SD",
  verbose = NULL
)
Arguments
x |
Name of the genlight object containing the SNP data [required]. |
nboots |
Number of bootstrap replicates to obtain confidence intervals [default 0]. |
boot.method |
Character specifying the bootstrap strategy: "ind" to resample individuals or "loc" to resample loci [default "loc"]. |
conf |
Numeric specifying the confidence level for the interval estimation [default 0.95]. |
CI.type |
Character specifying the type of nonparametric confidence interval: "norm", "basic", "perc", or "bca" [default "bca"]. |
plot.display |
Logical indicating if a plot should be produced [default TRUE]. |
plot.theme |
A ggplot2 theme to style the plots
[default |
plot.colors.pop |
A color palette for population plots or a list with as many colors as there are populations in the dataset [default gl.colors("dis")]. |
plot.dir |
Directory in which to save plot RDS files [default is the
current working directory or |
plot.file |
Base name (excluding extension) for the RDS file to save [default NULL]. |
error.bar |
Character specifying the statistic used for error bars: "SD" (standard deviation), "SE" (standard error), or "CI" (confidence intervals) [default "SD"]. |
verbose |
Verbosity: 0, silent or fatal errors; 1, begin and end; 2, progress log; 3, progress and results summary; 5, full report [default 2 or as specified using gl.set.verbosity]. |
Details
Allelic Richness via Rarefaction:
This function applies a rarefaction technique to standardize allelic richness. This approach mitigates biases that arise from differences in sampling depth and highlights the presence of less frequent alleles, which can be disproportionately important for long-term evolutionary potential and conservation. Rarefaction essentially calculates the expected number of distinct alleles you would observe in a subsample of fixed size.
Interpretation in Conservation Genetics:
Because allelic richness emphasizes rare alleles, it often reveals patterns of genetic differentiation that may be underestimated by measures relying primarily on allele-frequency distributions. In studies aiming to preserve or identify unique variants, allelic richness can highlight the most genetically distinct populations or pinpoint those at greater risk of losing rare allelic variants.
Error bars
The best method for presenting or assessing genetic statistics depends on the type of data you have and the specific questions you're trying to answer. Here's a brief overview of when you might use each method:
1. Confidence Intervals ("CI"):
- Usage: Often used to convey the precision of an estimate.
- Advantage: Confidence intervals give a range in which the true parameter (like a population mean) is likely to fall, given the data and a specified probability (like 95%).
- In Context: For genetic statistics, if you're estimating a parameter, a 95% CI gives you a range in which you're 95% confident the true parameter lies.
2. Standard Deviation ("SD"):
- Usage: Describes the amount of variation from the average in a set of data.
- Advantage: Allows for an understanding of the spread of individual data points around the mean.
- In Context: If you're looking at the distribution of a quantitative trait (like height) in a population with a particular genotype, the SD can describe how much individual heights vary around the average height.
3. Standard Error ("SE"):
- Usage: Describes the precision of the sample mean as an estimate of the population mean.
- Advantage: Smaller than the SD in large samples; it takes into account both the SD and the sample size.
- In Context: If you want to know how accurately your sample mean represents the population mean, you'd look at the SE.
Recommendation:
- If you're trying to convey the precision of an estimate, confidence intervals are very useful.
- For understanding variability within a sample, standard deviation is key.
- To see how well a sample mean might estimate a population mean, consider the standard error.
In practice, geneticists often use a combination of these methods to analyze and present their data, depending on their research questions and the nature of the data.
Confidence Intervals
The uncertainty of a parameter, in this case the mean of the statistic, can be summarised by a confidence interval (CI) which includes the true parameter value with a specified probability (i.e. confidence level; the parameter "conf" in this function).
In this function, CI are obtained using Bootstrap which is an inference method that samples with replacement the data (i.e. loci) and calculates the statistics every time.
This function uses the function boot (package boot) to perform the bootstrap replicates and the function boot.ci (package boot) to perform the calculations for the CI.
Four different types of nonparametric CI can be calculated (parameter "CI.type" in this function):
First order normal approximation interval ("norm").
Basic bootstrap interval ("basic").
Bootstrap percentile interval ("perc").
Adjusted bootstrap percentile interval ("bca").
The studentised bootstrap interval ("stud") was not included in the CI types because it is computationally intensive, it may produce estimates outside the range of plausible values and it has been found to be erratic in practice, see for example the "Studentised (t) Intervals" section in:
https://www.r-bloggers.com/2019/09/understanding-bootstrap-confidence-interval-output-from-the-r-boot-package/
Nice tutorials about the different types of CI can be found at
https://www.datacamp.com/tutorial/bootstrap-r
and
https://www.r-bloggers.com/2019/09/understanding-bootstrap-confidence-interval-output-from-the-r-boot-package
Efron and Tibshirani (1993, p. 162) and Davison and Hinkley (1997, p. 194) suggest that the number of bootstrap replicates should be between 1000 and 2000.
It is important to note that unreliable confidence intervals will be obtained if too few number of bootstrap replicates are used. Therefore, the function boot.ci will throw warnings and errors if bootstrap replicates are too few. Consider increasing the number of bootstrap replicates to at least 200.
The "bca" interval is often cited as the best for theoretical reasons, however it may produce unstable results if the bootstrap distribution is skewed or has extreme values. For example, you might get the warning "extreme order statistics used as endpoints" or the error "estimated adjustment 'a' is NA". In this case, you may want to use more bootstrap replicates or a different method or check your data for outliers.
The error "estimated adjustment 'w' is infinite" means that the estimated adjustment ‘w’ for the "bca" interval is infinite, which can happen when the empirical influence values are zero or very close to zero. This can be caused by various reasons, such as:
The number of bootstrap replicates is too small, the statistic of interest is constant or nearly constant across the bootstrap samples, the data contains outliers or extreme values.
You can try some possible solutions, such as:
Increasing the number of bootstrap replicates, using a different type of bootstrap confidence interval or removing or transforming the outliers or extreme values.
Confidence intervals that do not encompass the mean
When using bootstrap methods to estimate confidence intervals for rarefied metrics, the resampling distribution can be skewed—especially if the sample size is small. Skewness means the bootstrap‐estimated distribution may shift away from the sample mean, so percentile (or BCa) confidence intervals may legitimately exclude that mean. This does not necessarily indicate an error but can reflect genuine asymmetry in the data.
Value
A list of data frames (returned invisibly) containing:
$'Allelic Richness per site' – richness per site, corrected by rarefaction.
$'Allelic Richness per population' – richness summarised across sites, with the error-bar statistic.
$'Raw reference allele count'.
$'Raw alternate allele count'.
Author(s)
Author(s): Ching Ching Lau. Custodian: Ching Ching Lau – Post to https://groups.google.com/d/forum/dartr
References
El Mousadik, A. & Petit, R. J. (1996). High level of genetic differentiation for allelic richness among populations of the argan tree [Argania spinosa (L.) Skeels] endemic to Morocco. Theoretical and Applied Genetics, 92, 832–839.
See Also
Other unmatched report:
gl.allele.freq(),
gl.report.basics(),
gl.report.diversity(),
gl.report.polyploid_heterozygosity(),
gl.report.shannon()
Examples
  # Example usage:
  if (isTRUE(getOption("dartR_fbm"))) possums.gl <- gl.gen2fbm(possums.gl)
  results <- gl.report.allelerich(possums.gl)
  print(results)
Reports loci with all NA across individuals and/or individuals with all NA across loci
Description
This script reports loci or individuals with all calls missing (NA), from a genlight object.
Usage
gl.report.allna(x, by.pop = FALSE, verbose = NULL)
Arguments
x |
Name of the input genlight object [required]. |
by.pop |
If TRUE, loci that are all missing in any one population are reported [default FALSE] |
verbose |
Verbosity: 0, silent or fatal errors; 1, begin and end; 2, progress log; 3, progress and results summary; 5, full report [default 2, unless specified using gl.set.verbosity]. |
Details
A DArT dataset will not have loci for which the calls are scored all as missing (NA) for a particular individual, but such loci can arise rarely when populations or individuals are deleted. Similarly, a DArT dataset will not have individuals for which the calls are scored all as missing (NA) across all loci, but such individuals may sneak in to the dataset when loci are deleted. Retaining individual or loci with all NAs can cause issues for several functions.
Also, on occasions an analysis will require that there are some loci scored in each population. Setting by.pop=TRUE will result in removal of loci when they are all missing in any one population.
Note that loci that are missing for all individuals in a population are
not imputed with method 'frequency' or 'HW'. Consider
using the function gl.filter.allna with by.pop=TRUE.
Value
An unaltered genlight object
Author(s)
Author(s): Arthur Georges. Custodian: Arthur Georges – Post to https://groups.google.com/d/forum/dartr
See Also
Other matched report:
gl.report.callrate(),
gl.report.contamination(),
gl.report.excess.het(),
gl.report.factorloadings(),
gl.report.fstat(),
gl.report.hamming(),
gl.report.heterozygosity(),
gl.report.hwe(),
gl.report.ld(),
gl.report.ld.map(),
gl.report.locmetric(),
gl.report.maf(),
gl.report.overshoot(),
gl.report.pa(),
gl.report.rdepth(),
gl.report.replicates(),
gl.report.replicates.KING(),
gl.report.reproducibility(),
gl.report.secondaries(),
gl.report.taglength()
Examples
# SNP data
if (isTRUE(getOption("dartR_fbm"))) testset.gl <- gl.gen2fbm(testset.gl)
  result <- gl.report.allna(testset.gl, verbose=3)
# Tag P/A data
  result <- gl.report.allna(testset.gs, verbose=3)
Reports summary of base pair frequencies
Description
Calculates the frequencies of the four DNA nucleotide bases: adenine (A), cytosine (C), 'guanine (G) and thymine (T), and the frequency of transitions (Ts) and transversions (Tv) in a DArT genlight object.
Usage
gl.report.bases(
  x,
  plot.display = TRUE,
  plot.theme = theme_dartR(),
  plot.colors = NULL,
  plot.file = NULL,
  plot.dir = NULL,
  verbose = NULL,
  ...
)
Arguments
x |
Name of the genlight object containing the SNP or presence/absence (SilicoDArT) data [required]. |
plot.display |
If TRUE, resultant plots are displayed in the plot window [default TRUE]. |
plot.theme |
Theme for the plot. See Details for options [default theme_dartR()]. |
plot.colors |
List of two color names for the borders and fill of the plots [default c("#2171B5","#6BAED6")]. |
plot.file |
Name for the RDS binary file to save (base name only, exclude extension) [default NULL]. |
plot.dir |
Directory to save the plot RDS files [default as specified by the global working directory or tempdir()]. |
verbose |
Verbosity: 0, silent or fatal errors; 1, begin and end; 2, progress log; 3, progress and results summary; 5, full report [default NULL, adopting the global verbosity set by gl.set.verbosity(), or 2 if no global is set]. |
... |
Parameters passed to function ggsave, such as width and height, when the ggplot is to be saved. |
Details
The function checks first if trimmed sequences are included in the locus metadata (@other$loc.metrics$TrimmedSequence), and if so, tallies up the numbers of A, T, G and C bases. Only the reference state at the SNP locus is counted. Counts of transitions (Ts) and transversions (Tv) assume that there is no directionality, that is C->T is the same as T->C, because the reference state is arbitrary. For presence/absence data (SilicoDArT), it is not possible to count transversions or transitions or transversions/transitions ratio because the SNP data are not available, only a single sequence tag per locus. Only base frequencies are provided. A color vector can be obtained with gl.select.colors() and then passed to the function with the plot.colors parameter. If a plot.file is given, the ggplot arising from this function is saved as an "RDS" binary file using saveRDS(); can be reloaded with readRDS(). A file name must be specified for the plot to be saved. If a plot directory (plot.dir) is specified, the ggplot binary is saved to that directory; otherwise to the tempdir(). To avoid issues from inadvertent use of this function in an assignment statement, the function returns the genlight object unaltered.
Value
The unchanged genlight object
Author(s)
Author(s): Arthur Georges. Custodian: Arthur Georges – Post to https://groups.google.com/d/forum/dartr
See Also
Other matched reports:
gl.report.monomorphs()
Examples
# SNP data
if (isTRUE(getOption("dartR_fbm"))) testset.gl <- gl.gen2fbm(testset.gl)
  out <- gl.report.bases(testset.gl)
  col <- gl.select.colors(select=c(6,1),palette=rainbow, verbose=0)
  out <- gl.report.bases(testset.gl,plot.colors=col)
# Tag P/A data
  out <- gl.report.bases(testset.gs)
Basic statistics for a genlight object
Description
Calculates basic statistics for a genlight object.
Usage
gl.report.basics(x, verbose = NULL)
Arguments
x |
Name of the genlight object [required]. |
verbose |
Verbosity: 0, silent or fatal errors; 1, begin and end; 2, progress log; 3, progress and results summary; 5, full report [default 2, unless specified using gl.set.verbosity]. |
Value
Returns NULL invisibly; the results are printed to the console.
Author(s)
Author(s): Arthur Georges. Custodian: Arthur Georges (Post to https://groups.google.com/d/forum/dartr)
See Also
Other unmatched report:
gl.allele.freq(),
gl.report.allelerich(),
gl.report.diversity(),
gl.report.polyploid_heterozygosity(),
gl.report.shannon()
Examples
if (isTRUE(getOption("dartR_fbm"))) platypus.gl <- gl.gen2fbm(platypus.gl)
gl.report.basics(platypus.gl)
Reports summary of Call Rate for loci or individuals
Description
SNP datasets generated by DArT have missing values primarily arising from failure to call a SNP because of a mutation at one or both of the restriction enzyme recognition sites. P/A datasets (SilicoDArT) have missing values because it was not possible to call whether a sequence tag was amplified or not.
Usage
gl.report.callrate(
  x,
  method = "loc",
  ind.to.list = 20,
  plot.display = TRUE,
  plot.theme = theme_dartR(),
  plot.colors = NULL,
  plot.dir = NULL,
  plot.file = NULL,
  bins = 50,
  verbose = NULL,
  ...
)
Arguments
x |
Name of the genlight object containing the SNP or presence/absence (SilicoDArT) data [required]. |
method |
Specify the type of report by locus (method='loc') or individual (method='ind') [default 'loc']. |
ind.to.list |
Number of individuals to list for callrate [default 20] |
plot.display |
Specify if plot is to be displayed in the graphics window [default TRUE]. |
plot.theme |
User specified theme [default theme_dartR()]. |
plot.colors |
Vector with two color names for the borders and fill [default c("#2171B5", "#6BAED6")]. |
plot.dir |
Directory to save the plot RDS files [default as specified by the global working directory or tempdir()] |
plot.file |
Filename (minus extension) for the RDS plot file [Required for plot save] |
bins |
Number of bins to display in histograms [default 50]. |
verbose |
Verbosity: 0, silent or fatal errors; 1, begin and end; 2, progress log; 3, progress and results summary; 5, full report [default 2, unless specified using gl.set.verbosity]. |
... |
Parameters passed to function ggsave, such as width and height, when the ggplot is to be saved. |
Details
This function expects a genlight object, containing either SNP data or SilicoDArT (=presence/absence data).
Callrate is summarized by locus or by individual to allow sensible decisions on thresholds for filtering taking into consideration consequential loss of data. The summary is in the form of a tabulation and plots.
The table of quantiles is useful for deciding a threshold for subsequent filtering as it provides an indication of the percentages of loci that will be retained and lost.
In the case of method='ind', a list of individuals to be deleted is provided. To manage the screen output, this list is limited to ind.to.list individuals (or nInd(x)) whichever is the smaller.
To avoid issues from inadvertent use of this function in an assignment statement, the function returns the genlight object unaltered.
A color vector can be obtained with gl.select.colors() and then passed to the function with the plot.colors parameter.
If a plot.file is given, the ggplot arising from this function is saved as an "RDS" binary file using saveRDS(); can be reloaded with readRDS(). A file name must be specified for the plot to be saved.
If a plot directory (plot.dir) is specified, the ggplot binary is saved to that directory; otherwise to the tempdir().
Value
Returns unaltered genlight object
Author(s)
Author(s): Arthur Georges. Custodian: Arthur Georges – Post to https://groups.google.com/d/forum/dartr
See Also
Other matched report:
gl.report.allna(),
gl.report.contamination(),
gl.report.excess.het(),
gl.report.factorloadings(),
gl.report.fstat(),
gl.report.hamming(),
gl.report.heterozygosity(),
gl.report.hwe(),
gl.report.ld(),
gl.report.ld.map(),
gl.report.locmetric(),
gl.report.maf(),
gl.report.overshoot(),
gl.report.pa(),
gl.report.rdepth(),
gl.report.replicates(),
gl.report.replicates.KING(),
gl.report.reproducibility(),
gl.report.secondaries(),
gl.report.taglength()
Examples
# SNP data
  test.gl <- testset.gl[1:20,]
  gl.report.callrate(test.gl)
  gl.report.callrate(test.gl,method='ind')
  gl.report.callrate(test.gl,method='ind',plot.file="test")
# Tag P/A data
  test.gs <- testset.gs[1:20,]
  gl.report.callrate(test.gs)
  gl.report.callrate(test.gs,method='ind')

  if (isTRUE(getOption("dartR_fbm"))) testset.gl <- gl.gen2fbm(testset.gl)
  test.gl <- testset.gl[1:20,]
  gl.report.callrate(test.gl)
Screens a genlight object for cross-contaminated samples
Description
Flags individuals whose genotypes carry DNA from another sample, using two
tiers of evidence that need only the genotypes, the population labels and,
when available, the plate wells stored by gl.read.dart(). When the
genlight also holds the reads of each allele (from
gl.read.vcf(read.counts = TRUE)), a further tier tests the read
balance of each sample's heterozygous calls and names the two animals
whose DNA a mixed sample holds.
Usage
gl.report.contamination(
  x,
  rare.freq = 0.02,
  min.n = 5,
  z.flag = 3,
  min.excess = 0.02,
  rare.min.excess = 0.005,
  min.share = 20,
  share.tol = 0.05,
  depth.ratio = 1.5,
  depth.flat = 1.25,
  min.reads = 20,
  balance.cut = 0.25,
  min.calls = 1000,
  plate = NULL,
  plot.display = TRUE,
  plot.theme = theme_dartR(),
  plot.colors = NULL,
  plot.colors.pop = gl.colors("dis", verbose = 0),
  plot.dir = NULL,
  plot.file = NULL,
  verbose = NULL,
  ...
)
Arguments
x |
Name of the genlight object containing the SNP data [required]. |
rare.freq |
Allele frequency in the rest of the population below which an allele counts as rare; must lie in (0, 0.5) [default 0.02]. |
min.n |
Minimum number of other individuals in the population called at a locus for that locus to enter the rare-allele burden; at least 2 [default 5]. |
z.flag |
Robust z-score above which a statistic is an outlier [default 3]. |
min.excess |
Absolute amount by which heterozygosity must also exceed the population median to be flagged; a robust z-score alone over-flags populations whose members are nearly identical [default 0.02]. |
rare.min.excess |
The same absolute margin for the rare-allele burden, which is an order of magnitude smaller than heterozygosity [default 0.005]. |
min.share |
Minimum number of rare-allele loci an individual needs before its source is chosen by allele sharing rather than by residual kinship alone [default 20]. |
share.tol |
Sharing scores within this distance of the best are treated as ties and separated by residual kinship [default 0.05]. |
depth.ratio |
Foreign-allele rate in the deepest quartile of loci over the shallowest at or above which, with trend p below 0.01, the pattern is "dose" [default 1.5]. |
depth.flat |
The same ratio below which the pattern is "flat" [default 1.25]. |
min.reads |
Minimum number of reads (REF plus ALT) for a genotype to enter the read-balance test [default 20]. |
balance.cut |
Share of the reads below which the minority allele of a heterozygous call marks it as skewed; must lie in (0, 0.5] [default 0.25]. |
min.calls |
Minimum number of genotypes with at least
|
plate |
Data frame with columns id, plate and well (for example
"C4", in either case) giving plate positions; overrides positions found in the individual
metadata. Without it, positions come from |
plot.display |
If TRUE, resultant plots are displayed in the plot window [default TRUE]. |
plot.theme |
A ggplot2 theme for the plot, for example
|
plot.colors |
List of two color names, the first for suspect individuals and the second for the rest [default c("#2171B5","#6BAED6")]. |
plot.colors.pop |
A color palette for the plate map, or a vector with as many colors as there are populations [default gl.colors("dis")]. |
plot.dir |
Directory to save the plot RDS files [default as specified by the global working directory or tempdir()]. |
plot.file |
Name for the RDS binary file to save (base name only, exclude extension); the plate map is saved beside it with "_plate" appended [default NULL]. |
verbose |
Verbosity: 0, silent or fatal errors; 1, begin and end; 2, progress log; 3, progress and results summary; 5, full report [default NULL, adopting the global verbosity set by gl.set.verbosity(), or 2 if no global is set]. |
... |
Parameters passed to function ggsave, such as width and height, when the ggplot is to be saved. |
Details
Tier 1 scores each individual against the other members of its own
population. Heterozygosity is the proportion of called loci scored
heterozygous. The rare-allele burden is the proportion of called loci at
which the individual carries an allele whose frequency among the other
members of its population is below rare.freq; loci with fewer than
min.n other individuals called are skipped. Both statistics are
reported as a robust z-score (median and MAD within the population) and as
a fold over the population median.
Tier 2 names the most likely source of the foreign DNA. For an individual
with at least min.share rare-allele loci, every other individual is
scored by the proportion of those rare alleles it carries (sharing). The
candidates within share.tol of the best score, which in practice are
the members of one population, are then separated by residual kinship: a
VanRaden genomic relationship matrix halved to kinship, with each pair
expressed as a residual over the median kinship of its population pair so
that within- and between-population pairs are on the same scale. For an
individual with too few rare alleles (contamination from its own
population, or a clean sample) the partner is simply the largest residual.
The partner's sharing score and its residual kinship z-score against that
individual's other residuals are reported. If plate positions are known,
the partner is tested for plate adjacency (same plate, wells sharing an
edge). Positions are taken from
plate if supplied, otherwise from the plate_location column
of @other$ind.metrics written by gl.read.dart() (for
example "1-C2"; the well is the part after the last "-"), otherwise from plate and well columns.
Flags. An individual is a "suspect" when its heterozygosity has z-score
above z.flag and exceeds the population median by more than
min.excess.
Contamination always raises heterozygosity, so this is the required
signal. A suspect whose top kinship partner sits in an adjacent well is
upgraded to "adjacent". An individual whose rare-allele burden is elevated
by the same criteria but whose heterozygosity is normal is reported as
"rare-only" (z-score above z.flag and excess above
rare.min.excess): this is the signature of population structure
inside the assigned population, or of a mislabelled individual, not of
contamination. An individual whose read balance marks it as a mixture
(tier 4) is "mixed", which replaces "suspect", "rare-only" or no flag but
not "adjacent", where the plate position already explains the cause.
Tier 3 asks whether a flagged individual's foreign alleles behave like a
minority of its reads or like half of them. A contaminant contributes a
small fraction of the DNA, so its alleles are called mainly at loci with
enough depth to catch a minority allele; a hybrid's alleles sit at 50
percent and are called at any depth. The test uses the loci fixed for one
allele in the individual's population (frequency below rare.freq
among its unflagged members) and for the other allele in its partner's
population (frequency at least 1 - rare.freq among its unflagged
members), so that every locus could show the foreign allele. Restricting
to such loci matters because deep loci are the conserved ones and would
otherwise dilute the rate; building the references from unflagged
animals matters because a second contaminated animal in the host
population would otherwise remove every locus at which it carries the
donor allele. foreign.rate is the proportion of these loci at
which the individual carries the foreign allele, the plain measure of
how much of the other population it holds.
These loci are split into quartiles of rdepth, the per-locus
average read depth that gl.read.dart() stores in
@other$loc.metrics, and the proportion of them at which the
individual carries the foreign allele is compared across quartiles.
depth.ratio is that proportion in the deepest quartile over the
shallowest (with a half count added to each), depth.p a
chi-squared test for trend across the four quartiles, and pattern
is "saturated" when the foreign allele is already called at more than
half of the shallowest quartile (a heavy mixture or an F1 hybrid, which
depth cannot separate), "dose" when the ratio is at least
depth.ratio with p below 0.01 (a contaminant), "flat" when the
ratio is below depth.flat (a true heterozygote: hybrid, admixed
or mislabelled animal) and "unclear" between. The pattern is computed
for flagged individuals whose partner is in another population, with at
least 80 such loci and min.share foreign alleles among them, and
is NA otherwise or when the genlight has no rdepth; contamination
from the individual's own population, or from a population absent from
the dataset, cannot be tested this way. Read the pattern only when host
and partner are close enough for a hybrid to be plausible: across
species the plate-average depth is a poor proxy for the host's own depth,
and a "flat" call does not clear an animal whose foreign alleles are
fixed-absent in its species.
Locus average depth is a proxy for the individual's own read counts, so
the pattern does not change the flag; the decisive test remains allele
balance from per-individual read counts (tier 4).
Tier 4 uses the reads of each allele at each genotype, which
gl.read.vcf(read.counts = TRUE) stores in
@other$geno.metrics; without them its columns are NA. In a clean
sample the reads of a heterozygote split near 50:50. DNA from a second
animal adds heterozygous calls whose minority allele is carried by few
reads, and it does so even when both animals come from the same
population, where tiers 1 to 3 have little power. For each individual, the
genotypes called with at least min.reads reads are counted
(read.calls); skew.rate is the number of heterozygous calls
among them whose minority allele has less than balance.cut of the
reads, per 1,000 such genotypes. The rate is used rather than the share of
heterozygous calls that are skewed, because the share is inflated in
samples with few heterozygous calls, where genotyping errors make up much
of them. skew.z is a robust z-score across all individuals with at
least min.calls such genotypes, not within populations, because
read balance does not depend on population; individuals with fewer are not
screened, so a contaminated sample of low depth can be missed. The z-score
is relative to the cohort: when many samples are mixed (for example a
whole plate), the median and MAD rise and sensitivity falls. An individual
with skew.z above z.flag is "mixed".
For a mixed individual the function then looks for the two sources of its
DNA. main.source is the individual, other than mixed ones, with the
largest residual kinship to it. main.kin gives their kinship: a
duplicate is near 0.5, a mixed sample's extra heterozygous calls lower it
(0.39 for a sample with about 16 percent foreign DNA), and a first-degree
relative is near 0.25. Mixed individuals are excluded
so that a second library of the same DNA is not named. The extra sites are
those at which the individual is heterozygous and main.source
homozygous, both with at least min.reads reads; n.extra
counts them, and extra.share is the median share of the
individual's reads carried there by the allele main.source lacks.
The source columns below need min.share extra sites, and they are
left NA when extra.share is 0.35 or more: main.source is
then not the major genome of the sample (for example a relative, when that
genome is not in the dataset), and the extra sites hold the sample's own
heterozygotes. second.source is the individual, other than the
sample, main.source and mixed individuals, that carries the extra
allele at the largest share of the extra sites (second.share);
second.next is the best runner-up that is not a replicate of
second.source (identical genotypes at 90 percent or more of the
loci called in both), and second.gap the difference between their
shares. mix.fraction, the share of the sample's DNA that came from
second.source, is the median read share of the extra allele at the
extra sites where second.source is homozygous for it (at least 20
sites). It reads a little high for small fractions, because only reads
that produced a heterozygous call are counted.
Limits. The screen is a candidate list, not a verdict. Contamination from the same population as the host raises only heterozygosity and kinship, so a low rare-allele burden does not clear a suspect, and a population whose members differ widely in heterozygosity (inbreeding, admixture, relatives) can yield suspects that are not contaminated. Power falls as host and contaminant become genetically closer: a mixture between two populations of one species at a typical heterozygosity of 0.3 shifts heterozygosity by less than the natural spread of many populations. Tier 2 can only name a source that is in the dataset.
A file-backed (FBM) object is read from its backing file in blocks of
loci, and by individual for the suspects examined in tiers 3 and 4; the
genotype matrix is never decoded as a whole, and the results are
identical to those of the same data held in memory. The kinship matrix
(8 bytes per pair of individuals) is held in memory, as are read counts
in other$geno.metrics.
The plot shows heterozygosity against rare-allele burden with suspects
labelled. When plate positions are known, a second plot maps each plate
that holds a suspect: wells are filled by population, and a suspect's well
is ringed in the colour of its partner's population, solid with an arrow
from the partner when the partner sits in an adjacent well and dashed
otherwise, and labelled with its foreign.rate as a percentage and
its pattern, so that a hybrid next to its partner is not read as a
contaminant.
Value
A list with three elements: ind, a data frame with one row
per individual holding the tier 1 and tier 2 statistics (including
n.foreign, the number of rare-allele loci, and share, the
partner's sharing score), the tier 3 columns foreign.rate,
depth.ratio,
depth.p and pattern, the tier 4 columns read.calls,
skew.rate, skew.z, main.source, main.kin,
n.extra, extra.share, second.source,
second.share, second.next, second.gap and
mix.fraction, and the flag;
pairs, a data frame of plate-adjacent pairs with their kinship and
residual kinship, or NULL when no plate positions are known; and
kinship, the matrix of residual kinship.
Author(s)
Author(s): Luis Mijangos. Custodian: Luis Mijangos – Post to https://groups.google.com/d/forum/dartr
See Also
gl.filter.contamination,
gl.report.heterozygosity,
gl.filter.heterozygosity
Other matched report:
gl.report.allna(),
gl.report.callrate(),
gl.report.excess.het(),
gl.report.factorloadings(),
gl.report.fstat(),
gl.report.hamming(),
gl.report.heterozygosity(),
gl.report.hwe(),
gl.report.ld(),
gl.report.ld.map(),
gl.report.locmetric(),
gl.report.maf(),
gl.report.overshoot(),
gl.report.pa(),
gl.report.rdepth(),
gl.report.replicates(),
gl.report.replicates.KING(),
gl.report.reproducibility(),
gl.report.secondaries(),
gl.report.taglength()
Examples
if (isTRUE(getOption("dartR_fbm"))) testset.gl <- gl.gen2fbm(testset.gl)
out <- gl.report.contamination(testset.gl)
head(out$ind)
Calculates diversity indexes for SNPs
Description
This script takes a genlight object and calculates alpha and beta diversity for q = 0:2. Formulas are taken from Sherwin et al. 2017. The paper describes nicely the relationship between the different q levels and how they relate to population genetic processes such as dispersal and selection. The citation below also includes a link to a 3-minute video that explains, q, D and H.
Usage
gl.report.diversity(
  x,
  plot.display = TRUE,
  plot.theme = theme_dartR(),
  plot.colors.pop = gl.colors("dis", verbose = 0),
  plot.dir = NULL,
  plot.file = NULL,
  table = "DH",
  verbose = NULL
)
Arguments
x |
Name of the genlight object containing the SNP data [required]. |
plot.display |
Specify if plot is to be displayed in the graphics window [default TRUE]. |
plot.theme |
User specified theme [default theme_dartR()]. |
plot.colors.pop |
A color palette for population plots or a list with as many colors as there are populations in the dataset [default gl.colors("dis")]. |
plot.dir |
Directory to save the plot RDS files [default as specified by the global working directory or tempdir()]. |
plot.file |
Filename (minus extension) for the RDS plot file [Required for plot save]. |
table |
Prints a tabular output to the console either 'D'=D values, or 'H'=H values or 'DH','HD'=both or 'N'=no table. [default 'DH']. |
verbose |
Verbosity: 0, silent or fatal errors; 1, begin and end; 2, progress log; 3, progress and results summary; 5, full report [default 2 or as specified using gl.set.verbosity]. |
Details
For all indexes, the entropies (H) and corresponding effective numbers, i.e. Hill numbers (D), which reflect the number of needed entities to get the observed values, are calculated. In a nutshell, the alpha indexes between the different q-values should be similar if there is no deviation from expected allele frequencies and occurrences (e.g. all loci in HWE & equilibrium). If there is a deviation of an index, this links to a process causing it, such as dispersal, selection or strong drift. For a detailed explanation of all the indexes, we recommend resorting to the literature provided below. Error bars are +/- 1 standard deviation.
Function's output
If the function's parameter "table" = "DH" (the default value) is used, ten tables are printed to the console (at verbose >= 1) and the returned list has 20 components.
The first two show the number of loci used. The name of each of the rest of the tables starts with three terms separated by underscores.
The first term refers to the q value (0 to 2). The q values identify different ways of summarising diversity (H): q=0 is simply the number of alleles per locus, with no information about their relative proportions; q=2 is the expected heterozygosity, ie the chance of drawing two different alleles at random from the population; q=1 is the Shannon measure of ‘surprise, relating to how likely it is that the next allele drawn will be one that has not been seen before (Sherwin et al 2017, 2021, and associated video).
The second term refers to whether it is the diversity measure (H) or its transformation to Hill numbers (D) The D value tells you how many equally-frequent alleles there would need to be to give the corresponding H-value (in the actual population) The D-values are all in units of numbers of alleles, so they can be plotted against the q-value to get a rich representation of the diversity (Box 1, Fig II in Sherwin et al 2017, 2021, and associated video).
The third term refers to whether the diversity is calculated within populations (alpha) or between populations (beta).
In the case of alpha diversity tables, standard deviations have their own table, which finishes with a fourth term: "sd".
In the case of beta diversity tables, standard deviations are in the upper triangle of the matrix and diversity values are in the lower triangle of the matrix.
Plotting
Plot colours can be set with gl.select.colors().
If plot.file is specified, plots are saved to the directory specified by the user, or the global default working directory set by gl.set.wd() or to the tempdir().
Examples of other themes that can be used can be consulted in
Value
A list of entropy indexes for each level of q and equivalent numbers for alpha and beta diversity.
Author(s)
Author(s): Bernd Gruber. Custodian: Bernd Gruber (Post to https://groups.google.com/d/forum/dartr), Contributors: William B. Sherwin, Alexander Sentinella
References
Sherwin, W.B., Chao, A., Johst, L., Smouse, P.E. (2017, 2021). Information Theory Broadens the Spectrum of Molecular Ecology and Evolution. TREE 32(12) 948-963. doi:10.1016/j.tree.2017.09.12 AND TREE 36:955-6 doi.org/10.1016/j.tree.2021.07.005 AND 3-Minute video: ars.els-cdn.com/content/image/1-s2.0-S0169534717302550-mmc2.mp4
See Also
Other unmatched report:
gl.allele.freq(),
gl.report.allelerich(),
gl.report.basics(),
gl.report.polyploid_heterozygosity(),
gl.report.shannon()
Examples
if (isTRUE(getOption("dartR_fbm"))) bandicoot.gl <- gl.gen2fbm(bandicoot.gl)
div <- gl.report.diversity(bandicoot.gl, table = "N")
div$zero_H_alpha
div$two_H_beta
names(div)
Report loci with excess of heterozygosity [deprecated]
Description
Deprecated. Use
gl.report.hwe(direction = 'excess', min.hobs = 0.5,
method_sig = 'ChiSquare', multi_comp = TRUE, multi_comp_method = 'fdr',
cc_val = 0)
instead (cc_val = 0.5 for Yates = TRUE); see
gl.report.hwe.
This wrapper reproduces the workflow of Robledo-Ruiz et al. (2023) for identifying loci with a significant excess of heterozygotes (candidate sex-linked or paralogous loci) by calling gl.report.hwe with the equivalent settings, and will be removed in a future release.
Usage
gl.report.excess.het(
  x,
  Yates = FALSE,
  plot.display = TRUE,
  plot.theme = NULL,
  plot.colors = NULL,
  plot.file = NULL,
  plot.dir = NULL,
  verbose = NULL
)
Arguments
x |
Name of the genlight object containing the SNP data [required]. |
Yates |
Boolean for Yates's continuity correction. [default FALSE] |
plot.display |
Specify if plot is to be produced [default TRUE]. |
plot.theme |
Ignored (retained for backward compatibility). |
plot.colors |
Ignored (retained for backward compatibility). |
plot.file |
Ignored (retained for backward compatibility). |
plot.dir |
Ignored (retained for backward compatibility). |
verbose |
Verbosity: 0, silent or fatal errors; 1, begin and end; 2, progress log; 3, progress and results summary; 5, full report [default NULL, adopting the global verbosity set by gl.set.verbosity(), or 2 if no global is set]. |
Details
The published workflow is reproduced via gl.report.hwe(direction = 'excess', min.hobs = 0.5, ...): only loci with observed heterozygosity of at least 0.5 are tested, and the false-discovery-rate adjustment is confined to that screened set, as in the original. Differences from the original implementation: the plots are gl.report.hwe's ternary plots rather than the original before/after scatter plots, and the chi-square test is performed by HardyWeinberg::HWChisq (p-values can differ marginally from the original hand-rolled test). The parameters plot.theme, plot.colors, plot.file and plot.dir are accepted for backward compatibility but ignored; a warning names any that are supplied.
Value
A list with two elements: 'results.table' (the gl.report.hwe table for loci with significant heterozygote excess) and 'removed.loci' (a vector of the names of those loci), returned invisibly.
Author(s)
Author(s): Jesus Castrejon-Figueroa, Diana A Robledo-Ruiz. Custodian: Ching Ching Lau – Post to https://groups.google.com/d/forum/dartr
References
Robledo-Ruiz, D. A., Austin, L., Amos, J. N., Castrejon-Figueroa, J., Harley, D. K., Magrath, M. J., Sunnucks, P. & Pavlova, A. (2023). Easy-to-use R functions to separate reduced-representation genomic datasets into sex-linked and autosomal loci, and conduct sex assignment. Molecular Ecology Resources.
See Also
Other matched report:
gl.report.allna(),
gl.report.callrate(),
gl.report.contamination(),
gl.report.factorloadings(),
gl.report.fstat(),
gl.report.hamming(),
gl.report.heterozygosity(),
gl.report.hwe(),
gl.report.ld(),
gl.report.ld.map(),
gl.report.locmetric(),
gl.report.maf(),
gl.report.overshoot(),
gl.report.pa(),
gl.report.rdepth(),
gl.report.replicates(),
gl.report.replicates.KING(),
gl.report.reproducibility(),
gl.report.secondaries(),
gl.report.taglength()
Examples
if (isTRUE(getOption("dartR_fbm"))) LBP <- gl.gen2fbm(LBP)
filtered.table <- gl.report.excess.het(x = LBP, Yates = TRUE)
Reports factor loadings for a PCA or PCoA
Description
Extracts the factor loadings from a glPCA object (generated by gl.pcoa) and plots their distribuion.
Usage
gl.report.factorloadings(
  pca,
  axis = 1,
  n.display = 15,
  plot.display = TRUE,
  plot.theme = theme_dartR(),
  plot.colors = NULL,
  plot.file = NULL,
  plot.dir = NULL,
  bins = 25,
  verbose = NULL,
  ...
)
Arguments
pca |
Name of the glPCA object containing factor loadings [required]. |
axis |
Axis in the ordination used to display the factor loadings [default 1] |
n.display |
Number of loci for which to display factorloadings [default 15] |
plot.display |
If TRUE, resultant plots are displayed in the plot window [default TRUE]. |
plot.theme |
Theme for the plot. See Details for options [default theme_dartR()]. |
plot.colors |
List of two color names for the borders and fill of the plots [default c("#2171B5","#6BAED6")]. |
plot.file |
Name for the RDS binary file to save (base name only, exclude extension) [default NULL] |
plot.dir |
Directory to save the plot RDS files [default as specified by the global working directory or tempdir()] |
bins |
Number of bins to display in histograms [default 25]. |
verbose |
Verbosity: 0, silent or fatal errors; 1, begin and end; 2, progress log; 3, progress and results summary; 5, full report [default NULL, adopting the global verbosity set by gl.set.verbosity(), or 2 if no global is set]. |
... |
Parameters passed to function ggsave, such as width and height, when the ggplot is to be saved. |
Details
The function extracts the factor loadings for a given axis from a PCA object generated by gl.pcoa and plots their magnitudes. Useful for identifying loci that load high for a given axis.
A color vector can be obtained with gl.select.colors() and then passed to the function with the plot.colors parameter.
Themes can be obtained from in
If a plot.file is given, the ggplot arising from this function is saved as an "RDS" binary file using saveRDS(); can be reloaded with readRDS(). A file name must be specified for the plot to be saved. If a plot directory (plot.dir) is specified, the ggplot binary is saved to that directory; otherwise to the tempdir().
Value
A data.frame of the factor loadings for the nominated axis, one row per locus, returned invisibly.
Author(s)
Author(s): Arthur Georges. Custodian: Arthur Georges – Post to https://groups.google.com/d/forum/dartr
See Also
Other matched report:
gl.report.allna(),
gl.report.callrate(),
gl.report.contamination(),
gl.report.excess.het(),
gl.report.fstat(),
gl.report.hamming(),
gl.report.heterozygosity(),
gl.report.hwe(),
gl.report.ld(),
gl.report.ld.map(),
gl.report.locmetric(),
gl.report.maf(),
gl.report.overshoot(),
gl.report.pa(),
gl.report.rdepth(),
gl.report.replicates(),
gl.report.replicates.KING(),
gl.report.reproducibility(),
gl.report.secondaries(),
gl.report.taglength()
Examples
if (isTRUE(getOption("dartR_fbm"))) testset.gl <- gl.gen2fbm(testset.gl)
pca <- gl.pcoa(testset.gl)
gl.report.factorloadings(pca = pca)
Reports various statistics of genetic differentiation between populations with confidence intervals
Description
This function calculates four genetic differentiation between populations statistics (see the "Details" section for further information).
-
Fst - Measure of the degree of genetic differentiation of subpopulations (Nei, 1987).
-
Fstp - Unbiased (i.e. corrected for sampling error, see explanation below) Fst (Nei, 1987).
-
Dest - Jost's D (Jost, 2008).
-
Gst_H - Gst standardized by the maximum level that it can obtain for the observed amount of genetic variation (Hedrick 2005).
Sampling errors arise because allele frequencies in our samples differ from those in the subpopulations from which they were taken (Holsinger, 2012).
Confidence Intervals are obtained by bootstrapping over loci.
Usage
gl.report.fstat(
  x,
  nboots = 0,
  conf = 0.95,
  CI.type = "bca",
  ncpus = 1,
  plot.stat = "Fstp",
  plot.display = TRUE,
  palette.divergent = gl.colors("div", verbose = 0),
  font.size = 0.5,
  plot.dir = NULL,
  plot.file = NULL,
  verbose = NULL,
  ...
)
Arguments
x |
Name of the genlight object containing the SNP data [required]. |
nboots |
Number of bootstrap replicates to obtain confidence intervals. A whole number, either 0 (no bootstrap) or at least 2; with CI.type = "bca", at least 200 [default 0]. |
conf |
The confidence level of the required interval, between 0 and 1 [default 0.95]. |
CI.type |
Method to estimate confidence intervals. One of "norm", "basic", "perc" or "bca" [default "bca"]. |
ncpus |
Number of processes to be used in parallel operation. If ncpus > 1 parallel operation is activated,see "Details" section [default 1]. |
plot.stat |
Statistic to plot. One of "Fst","Fstp","Dest" or "Gst_H" [default "Fstp"]. |
plot.display |
If TRUE, a heatmap of the pairwise static chosen is displayed in the plot window [default TRUE]. |
palette.divergent |
A color palette function for the heatmap plot [default gl.colors("div")]. |
font.size |
Size of font for the labels of horizontal and vertical axes of the heatmap [default 0.5]. |
plot.dir |
Directory in which to save files [default working directory]. |
plot.file |
Name for the RDS binary file to save (base name only, exclude extension) [default NULL]. |
verbose |
Verbosity: 0, silent or fatal errors; 1, begin and end; 2, progress log; 3, progress and results summary; 5, full report [default NULL, adopting the global verbosity set by gl.set.verbosity(), or 2 if no global is set]. |
... |
Parameters passed to function heatmap.2 (package gplots). |
Details
Even though Fst and its relatives can predict evolutionary processes (Holsinger & Weir, 2009), they are not true measures of genetic differentiation in the sense that they are dependent on the diversity within populations (Meirmans & Hedrick, 2011), the number of populations analysed (Alcala & Rosenberg, 2017) and are not monotonic (Sherwin et al., 2017). Recent approaches have been developed to accommodate these mathematical restrictions (G'ST; "Gst_H"; Hedrick, 2005, and Jost's D; "Dest"; Jost, 2008). More recently, novel approaches based on information theory (Mutual Information; Sherwin et al., 2017) and allele frequencies (Allele Frequency Difference; Berner, 2019) have distinct properties that make them valuable resources to interpret genetic differentiation between populations.
Note that each measure of genetic differentiation has advantages and drawbacks, and the decision of using a particular measure is usually based on the research question.
Statistics calculated
The equations used to calculate the statistics are shown below.
-
Ho - Unbiased estimate of observed heterozygosity across subpopulations (Nei, 1987, pp. 164, eq. 7.38) is calculated as:

where Pkii represents the proportion of homozygote ii for allele i in individual k and s represents the number of subpopulations.
-
Hs - Unbiased estimate of the expected heterozygosity under Hardy-Weinberg equilibrium across subpopulations (Nei, 1987, pp. 164, eq. 7.39) is calculated as:
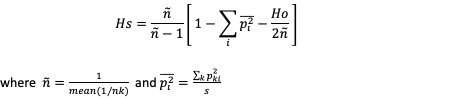
where ñ is the harmonic mean of nk (the number of individuals in each subpopulation), pki is the proportion (sometimes misleadingly called frequency) of allele i in subpopulation k.
-
Ht - Heterozygosity for the total population (Nei, 1987, pp. 164, eq. 7.40) is calculated as:

-
Dst - The average allele frequency differentiation between populations (Nei, 1987, pp. 163) is calculated as:

-
Htp - Unbiased estimate of Heterozygosity for the total population (Nei, 1987, pp. 165) is calculated as:

-
Dstp - Unbiased estimate of the average allele frequency differentiation between populations (Nei, 1987, pp. 165), where s is the number of subpopulations that carry the locus, is calculated as:
Dstp = Dst * s / (s - 1) -
Fst - Measure of the extent of genetic differentiation of subpopulations (Nei, 1987, pp. 162, eq. 7.34) is calculated as:

-
Fstp - Unbiased measure of the extent of genetic differentiation of subpopulations (Nei, 1987, pp. 163, eq. 7.36) is calculated as:

-
Dest - Jost's D (Jost, 2008, eq. 12) is calculated as:
Dest = Dstp / (1 - Hs) -
Gst-max - The maximum level that Gst can obtain for the observed amount of genetic variation (Hedrick 2005, eq. 4a) is calculated as:

-
Gst-H - Gst standardized by the maximum level that it can obtain for the observed amount of genetic variation (Hedrick 2005, eq. 4b) is calculated as:

Confidence Intervals
The uncertainty of a parameter, in this case the mean of the statistic, can be summarised by a confidence interval (CI) which includes the true parameter value with a specified probability (i.e. confidence level; the parameter "conf" in this function).
In this function, CI are obtained using Bootstrap which is an inference method that samples with replacement the data and calculates the statistics every time.
The unit of resampling is the locus, which is the unit the statistics are averaged over. Each of the "nboots" replicates draws nLoc loci with replacement from the pair of populations being compared, and the four statistics are recalculated on that replicate by the same estimator that produces the reported value.
This function uses the function boot (package boot) to perform the bootstrap replicates and the function boot.ci (package boot) to perform the calculations for the CI.
The function has no seed parameter. To obtain the same intervals twice,
set the global random number generator immediately before the call, for
example set.seed(1234).
Four different types of nonparametric CI can be calculated (parameter "CI.type" in this function):
First order normal approximation interval ("norm").
Basic bootstrap interval ("basic").
Bootstrap percentile interval ("perc").
Adjusted bootstrap percentile interval ("bca").
The studentized bootstrap interval ("stud") was not included in the CI types because it is computationally intensive, it may produce estimates outside the range of plausible values and it has been found to be erratic in practice, see for example the "Studentized (t) Intervals" section in:
https://www.r-bloggers.com/2019/09/understanding-bootstrap-confidence-interval-output-from-the-r-boot-package/
Nice tutorials about the different types of CI can be found in:
https://www.datacamp.com/tutorial/bootstrap-r
and
https://www.r-bloggers.com/2019/09/understanding-bootstrap-confidence-interval-output-from-the-r-boot-package/
Efron and Tibshirani (1993, p. 162) and Davison and Hinkley (1997, p. 194) suggest that the number of bootstrap replicates should be between 1000 and 2000.
It is important to note that unreliable confidence intervals will be obtained if too few number of bootstrap replicates are used. Therefore, the function boot.ci will throw warnings and errors if bootstrap replicates are too few. Consider increasing then number of bootstrap replicates to at least 200. With the default CI.type = "bca", fewer than 200 replicates is refused with an informative error rather than passed to boot.ci, which fails with "estimated adjustment 'a' is NA".
The "bca" interval is often cited as the best for theoretical reasons, however it may produce unstable results if the bootstrap distribution is skewed or has extreme values. For example, you might get the warning "extreme order statistics used as endpoints" or the error "estimated adjustment 'a' is NA". In this case, you may want to use more bootstrap replicates or a different method or check your data for outliers.
The error "estimated adjustment 'w' is infinite" means that the estimated adjustment ‘w’ for the "bca" interval is infinite, which can happen when the empirical influence values are zero or very close to zero. This can be caused by various reasons, such as:
The number of bootstrap replicates is too small, the statistic of interest is constant or nearly constant across the bootstrap samples, the data contains outliers or extreme values.
You can try some possible solutions, such as:
Increasing the number of bootstrap replicates, using a different type of bootstrap confidence interval or removing or transforming the outliers or extreme values.
Plotting
The plot can be customised by including any parameter(s) from the function heatmap.2 (package gplots).
For the color palette you could try for example:
> library(viridis)
> res <- gl.report.fstat(platypus.gl, palette.divergent = viridis)
If a plot.file is given, the plot arising from this function is saved as an "RDS" binary file using the function saveRDS (package base); can be reloaded with function readRDS (package base). A file name must be specified for the plot to be saved.
If a plot directory (plot.dir) is specified, the gplot binary is saved to that directory; otherwise to the tempdir().
Your plot might not shown in full because your 'Plots' pane is too small (in RStudio). Increase the size of the 'Plots' pane before running the function. Alternatively, use the parameter 'plot.file' to save the plot to a file.
Parallelisation
If the parameter ncpus > 1, parallelisation is enabled. In Windows, parallel computing employs a "socket" approach that starts new copies of R on each core. POSIX systems, on the other hand (Mac, Linux, Unix, and BSD), utilise a "forking" approach that replicates the whole current version of R and transfers it to a new core.
Opening and terminating R sessions in each core involves a significant amount of processing time, therefore parallelisation in Windows machines is only quicker than not using parallelisation when nboots > 1000-2000.
Value
The shape of the returned object depends on the number of populations and on whether a bootstrap was requested. In every shape the statistics are Fst, Fstp, Dest and Gst_H, and pairs of populations are named "<pop1>_vs_<pop2>".
More than two populations, nboots > 0: a list of two elements. "Stat_matrices" holds one nPop x nPop symmetric matrix per statistic; "Confidence_Intervals" holds one data frame per pair of populations, with one row per statistic and columns "Value", "LCI" (low confidence interval) and "HCI" (high confidence interval).
Two populations, nboots > 0: a list of two elements. "Stat_tables" is a data frame with one row per statistic and one column for the pair; "Confidence_Intervals" is a single data frame with columns "Value", "LCI" and "HCI".
More than two populations, nboots = 0: a list of two elements, "Stat_matrices" as above and "Stat_tables", a data frame with one row per statistic and one column per pair of populations.
Two populations, nboots = 0: a data frame with one row per statistic and one column for the pair, not a list.
Author(s)
Author(s): Luis Mijangos. Custodian: Luis Mijangos – Post to https://groups.google.com/d/forum/dartr
References
-
Alcala, N., & Rosenberg, N. A. (2017). Mathematical constraints on FST: Biallelic markers in arbitrarily many populations. Genetics (206), 1581-1600.
-
Berner, D. (2019). Allele frequency difference AFD–an intuitive alternative to FST for quantifying genetic population differentiation. Genes, 10(4), 308.
-
Davison AC, Hinkley DV (1997). Bootstrap Methods and their Application. Cambridge University Press: Cambridge.
-
Efron, B. (1979). Bootstrap methods: Another look at the jackknife. Annals of Statistics 7, 1–26.
-
Efron B, Tibshirani RJ (1993). An Introduction to the Bootstrap. Chapman and Hall: London.
-
Hedrick, P. W. (2005). A standardized genetic differentiation measure. Evolution, 59(8), 1633-1638.
-
Holsinger, K. E. (2012). Lecture notes in population genetics.
-
Holsinger, K. E., & Weir, B. S. (2009). Genetics in geographically structured populations: defining, estimating and interpreting FST. Nature Reviews Genetics, 10(9), 639- 650.
-
Jost, L. (2008). GST and its relatives do not measure differentiation. Molecular Ecology, 17(18), 4015-4026.
-
Meirmans, P. G., & Hedrick, P. W. (2011). Assessing population structure: FST and related measures. Molecular Ecology Resources, 11(1), 5-18.
-
Nei, M. (1987). Molecular evolutionary genetics: Columbia University Press.
-
Sherwin, W. B., Chao, A., Jost, L., & Smouse, P. E. (2017). Information theory broadens the spectrum of molecular ecology and evolution. Trends in Ecology & Evolution, 32(12), 948-963.
See Also
Other matched report:
gl.report.allna(),
gl.report.callrate(),
gl.report.contamination(),
gl.report.excess.het(),
gl.report.factorloadings(),
gl.report.hamming(),
gl.report.heterozygosity(),
gl.report.hwe(),
gl.report.ld(),
gl.report.ld.map(),
gl.report.locmetric(),
gl.report.maf(),
gl.report.overshoot(),
gl.report.pa(),
gl.report.rdepth(),
gl.report.replicates(),
gl.report.replicates.KING(),
gl.report.reproducibility(),
gl.report.secondaries(),
gl.report.taglength()
Examples
if (isTRUE(getOption("dartR_fbm"))) platypus.gl <- gl.gen2fbm(platypus.gl)
res <- gl.report.fstat(platypus.gl)
Reports pairwise Hamming distances between trimmed sequence tags and the loci that gl.filter.hamming would remove
Description
Hamming distance is calculated as the number of base
differences between two sequences. In the context of DArT trimmed
sequences, which are anchored to the left by the restriction enzyme
recognition sequence, sequences are compared starting immediately after the
common recognition sequence, over a fixed-length substring
(min.length bases), exactly as in
gl.filter.hamming.
The function reports (a) the distribution of pairwise Hamming distances
among comparable loci, and (b) for a range of candidate thresholds, the
exact number of loci that gl.filter.hamming would remove.
The counts in (b) are obtained by running the same comparison engine, with
the same worst-to-best call-rate ordering, as the filter itself — they are
therefore exact, not an approximation from the distance distribution.
Usage
gl.report.hamming(
  x,
  rs = 5,
  threshold = 3,
  min.length = 50,
  max.threshold = 10,
  plot.display = TRUE,
  plot.theme = theme_dartR(),
  plot.colors = NULL,
  plot.dir = NULL,
  plot.file = NULL,
  tag.length = NULL,
  probar = NULL,
  verbose = NULL
)
Arguments
x |
Name of the genlight object containing the SNP or SilicoDArT data [required]. |
rs |
Number of bases to skip from the start of the TrimmedSequence before extracting the comparison substring (i.e. restriction site length) [default 5]. |
threshold |
Candidate maximum Hamming distance (number of mismatching
bases) to highlight in the plots and summary, matching the
|
min.length |
Length of the substring used for Hamming comparisons. Longer sequences are truncated to it; only loci producing a substring of exactly this length are compared, others are ignored (and would be retained by the filter) [default 50]. |
max.threshold |
Largest threshold simulated in the loci-removed table and plot [default 10]. |
plot.display |
Specify if plot is to be produced [default TRUE]. |
plot.theme |
User specified theme [default theme_dartR()]. |
plot.colors |
Vector with two color names for the borders and fill [default c("#2171B5", "#6BAED6")]. |
plot.dir |
Directory to save the plot RDS files [default as specified by the global working directory or tempdir()] |
plot.file |
Filename (minus extension) for the RDS plot file [Required for plot save] |
tag.length |
Deprecated and ignored; distances are reported as base
counts over |
probar |
Deprecated and ignored; the compiled engine makes a progress bar unnecessary [default NULL]. |
verbose |
Verbosity: 0, silent or fatal errors; 1, begin and end; 2, brief progress messages; 3, progress and results summary; 5, full report [default 2, unless specified using gl.set.verbosity]. |
Details
The function gl.filter.hamming removes one locus of
a pair whose substrings are within threshold mismatches, keeping
the locus with the better call rate. Because the filter is sequential (a
removed locus is not used to match further loci), the number of loci
removed at a given threshold cannot be derived from the pairwise distance
distribution alone; this function obtains it by running the filter's own
engine in simulation mode for each candidate threshold.
Pairwise distances are computed in compiled code. When the number of comparable locus pairs exceeds two million, a random sample of two million pairs is used for the distribution (the loci-removed simulation is always exact and unaffected); a note is printed when sampling occurs.
This function requires the package Rcpp and a working C++ compiler
toolchain (Rtools on Windows, Xcode Command Line Tools on macOS), as the
comparison engine is compiled at run time (once per session).
If plot.file is specified, plots are saved to the directory specified by the user, or the global default working directory set by gl.set.wd() or to the tempdir().
Examples of other themes that can be used can be consulted in
Value
Invisibly, a data frame with one row per candidate threshold
(0 to max.threshold) and columns Threshold, Removed,
Percent.removed, Retained and Percent.retained: the
loci that gl.filter.hamming would remove at each threshold.
Earlier versions returned the genlight object unchanged.
Author(s)
Author(s): Arthur Georges. Custodian: Arthur Georges – Post to https://groups.google.com/d/forum/dartr
See Also
Other matched report:
gl.report.allna(),
gl.report.callrate(),
gl.report.contamination(),
gl.report.excess.het(),
gl.report.factorloadings(),
gl.report.fstat(),
gl.report.heterozygosity(),
gl.report.hwe(),
gl.report.ld(),
gl.report.ld.map(),
gl.report.locmetric(),
gl.report.maf(),
gl.report.overshoot(),
gl.report.pa(),
gl.report.rdepth(),
gl.report.replicates(),
gl.report.replicates.KING(),
gl.report.reproducibility(),
gl.report.secondaries(),
gl.report.taglength()
Examples
if (isTRUE(getOption("dartR_fbm"))) testset.gl <- gl.gen2fbm(testset.gl)
res <- gl.report.hamming(testset.gl[,1:100])
res
Reports observed, expected and unbiased heterozygosities and FIS (inbreeding coefficient) by population or by individual from SNP data
Description
Calculates the observed, expected and unbiased expected (i.e. corrected for sample size) heterozygosities and FIS (inbreeding coefficient) for each population or the observed heterozygosity for each individual in a genlight object.
Usage
gl.report.heterozygosity(
  x,
  method = "pop",
  n.invariant = 0,
  subsample.pop = FALSE,
  n.limit = 10,
  nboots = 0,
  boot.method = "ind",
  conf = 0.95,
  CI.type = "bca",
  ncpus = 1,
  plot.display = TRUE,
  plot.theme = theme_dartR(),
  plot.colors.pop = gl.colors("dis"),
  plot.colors.ind = gl.colors(2),
  plot.file = NULL,
  plot.dir = NULL,
  error.bar = "SD",
  verbose = NULL
)
Arguments
x |
Name of the genlight object containing the SNP data [required]. |
method |
Calculate heterozygosity by population (method='pop') or by individual (method='ind') [default 'pop']. |
n.invariant |
An estimate of the number of invariant sequence tags used to adjust the heterozygosity rate [default 0]. |
subsample.pop |
Whether subsample populations to estimate observed heterozygosity (see Details) [default FALSE]. |
n.limit |
Minimum number of individuals that should have a population to perform subsampling to estimate heterozygosity [default 10]. |
nboots |
Number of bootstrap replicates to obtain confidence intervals [default 0]. |
boot.method |
boostraping across individuals ("ind") or across loci ("loc") [default "ind"]. |
conf |
The confidence level of the required interval [default 0.95]. |
CI.type |
Method to estimate confidence intervals. One of "norm", "basic", "perc" or "bca" [default "bca"]. |
ncpus |
Number of processes to be used in parallel operation. If ncpus > 1 parallel operation is activated, see "Details" section [default 1]. |
plot.display |
Specify if plot is to be produced [default TRUE]. |
plot.theme |
Theme for the plot. See Details for options [default theme_dartR()]. |
plot.colors.pop |
A color palette for population plots or a list with as many colors as there are populations in the dataset [default gl.colors("dis")]. |
plot.colors.ind |
List of two color names for the borders and fill of the plot by individual [default gl.colors(2)]. |
plot.file |
Name for the RDS binary file to save (base name only, exclude extension) [default NULL]. |
plot.dir |
Directory to save the plot RDS files [default as specified by the global working directory or tempdir()]. |
error.bar |
Statistic to be plotted as error bar either "SD" (standard deviation) or "SE" (standard error) or "CI" (confidence intervals) [default "SD"]. |
verbose |
Verbosity: 0, silent or fatal errors; 1, begin and end; 2, progress log; 3, progress and results summary; 5, full report [default NULL, unless specified using gl.set.verbosity]. |
Details
Observed heterozygosity for a population takes the proportion of heterozygous loci for each individual and averages it over all individuals in that population. The calculations take into account missing values.
Expected heterozygosity for a population takes the expected proportion of heterozygotes, that is, expected under Hardy-Weinberg equilibrium, for each locus, then averages this across the loci for an average estimate for the population.
The unbiased expected heterozygosity is calculated using the correction for sample size following equation 2 from Nei 1978.
Accuracy of all heterozygosity estimates is affected by small sample sizes, and so is their comparison between populations or repeated analysis. Expected heterozygosities are less affected because their calculations are based on allele frequencies while observed heterozygosities are strongly susceptible to sampling effects when the sample size is small.
Observed heterozygosity for individuals is calculated as the proportion of loci that are heterozygous for that individual.
Finally, the loci that are invariant across all individuals in the dataset
(that is, across populations), is typically unknown. This can render
estimates of heterozygosity analysis specific, and so it is not valid to
compare such estimates across species or even across different analyses
(see Schmidt et al 2021). This is a similar problem faced by microsatellites.
If you have an estimate of the
number of invariant sequence tags (loci) in your data, such as provided by
gl.report.secondaries, you can specify it with the n.invariant
parameter to standardize your estimates of heterozygosity. This is called
autosomal heterozygosities by Schmidt et al (2021).
NOTE: It is important to realise that estimation of adjusted (autosomal) heterozygosity requires that secondaries not to be removed.
Heterozygosities and FIS (inbreeding coefficient) are calculated by locus within each population using the following equations, and then averaged across all loci:
Observed heterozygosity (Ho) = number of heterozygotes / n_Ind, where n_Ind is the number of individuals without missing data for that locus.
Observed heterozygosity adjusted (Ho.adj) <- Ho * n_Loc / (n_Loc + n.invariant), where n_Loc is the number of loci that do not have all missing data and n.invariant is an estimate of the number of invariant loci to adjust heterozygosity.
Expected heterozygosity (He) = 1 - (p^2 + q^2), where p is the frequency of the reference allele and q is the frequency of the alternative allele.
Expected heterozygosity adjusted (He.adj) = He * n_Loc / (n_Loc + n.invariant)
Unbiased expected heterozygosity (uHe) = He * (2 * n_Ind / (2 * n_Ind - 1))
Inbreeding coefficient (FIS) = 1 - Ho / uHe
Function's output
Output for method='pop' is an ordered barchart of observed heterozygosity, unbiased expected heterozygosity and FIS (Inbreeding coefficient) across populations together with a table of mean observed and expected heterozygosities and FIS by population and their respective standard deviations (SD). In the output, it is also reported by population: the mean number of individuals with a non-missing genotype per locus (n.Ind), which is the denominator used to calculate Ho; because of missing data this is an average across loci, so it usually shows decimals slightly below the number of individuals in the population. Also reported are the number of loci used to estimate heterozygosity (n.Loc), the number of polymorphic loci (polyLoc), the number of monomorphic loci (monoLoc) and loci with all missing data (all_NALoc).
Output for method='ind' is a histogram and a boxplot of heterozygosity across individuals.
If a plot.file is given, the ggplot arising from this function is saved as an "RDS" binary file using saveRDS(); can be reloaded with readRDS(). A file name must be specified for the plot to be saved.
If a plot directory (plot.dir) is specified, the ggplot binary is saved to that directory; otherwise to the tempdir().
Examples of other themes that can be used can be consulted in:
Subsampling populations
To test the effect of five population sample sizes (n = 10, 5, 4, 3, 2) on observed heterozygosity estimates, the function subsamples individuals, without replacement. The subsampling is repeated 10 times for each sample size n. This approach is not an implementation of Schmidt et al (2021). Please refer to this paper for additional complexities in estimating heterozygosity using SNP data.
Error bars
The best method for presenting or assessing genetic statistics depends on the type of data you have and the specific questions you're trying to answer. Here's a brief overview of when you might use each method:
1. Confidence Intervals ("CI"):
- Usage: Often used to convey the precision of an estimate.
- Advantage: Confidence intervals give a range in which the true parameter (like a population mean) is likely to fall, given the data and a specified probability (like 95%).
- In Context: For genetic statistics, if you're estimating a parameter, a 95% CI gives you a range in which you're 95% confident the true parameter lies.
2. Standard Deviation ("SD"):
- Usage: Describes the amount of variation from the average in a set of data.
- Advantage: Allows for an understanding of the spread of individual data points around the mean.
- In Context: If you're looking at the distribution of a quantitative trait (like height) in a population with a particular genotype, the SD can describe how much individual heights vary around the average height.
3. Standard Error ("SE"):
- Usage: Describes the precision of the sample mean as an estimate of the population mean.
- Advantage: Smaller than the SD in large samples; it takes into account both the SD and the sample size.
- In Context: If you want to know how accurately your sample mean represents the population mean, you'd look at the SE.
Recommendation:
- If you're trying to convey the precision of an estimate, confidence intervals are very useful.
- For understanding variability within a sample, standard deviation is key.
- To see how well a sample mean might estimate a population mean, consider the standard error.
In practice, geneticists often use a combination of these methods to analyze and present their data, depending on their research questions and the nature of the data.
Confidence Intervals
The uncertainty of a parameter, in this case the mean of the statistic, can be summarised by a confidence interval (CI) which includes the true parameter value with a specified probability (i.e. confidence level; the parameter "conf" in this function).
In this function, CI are obtained using Bootstrap which is an inference method that samples with replacement the data (i.e. loci) and calculates the statistics every time.
This function uses the function boot (package boot) to perform the bootstrap replicates and the function boot.ci (package boot) to perform the calculations for the CI.
Four different types of nonparametric CI can be calculated (parameter "CI.type" in this function):
First order normal approximation interval ("norm").
Basic bootstrap interval ("basic").
Bootstrap percentile interval ("perc").
Adjusted bootstrap percentile interval ("bca").
The studentized bootstrap interval ("stud") was not included in the CI types because it is computationally intensive, it may produce estimates outside the range of plausible values and it has been found to be erratic in practice, see for example the "Studentized (t) Intervals" section in:
https://www.r-bloggers.com/2019/09/understanding-bootstrap-confidence-interval-output-from-the-r-boot-package
Nice tutorials about the different types of CI can be found in:
https://www.datacamp.com/tutorial/bootstrap-r
and
https://www.r-bloggers.com/2019/09/understanding-bootstrap-confidence-interval-output-from-the-r-boot-package
Efron and Tibshirani (1993, p. 162) and Davison and Hinkley (1997, p. 194) suggest that the number of bootstrap replicates should be between 1000 and 2000.
It is important to note that unreliable confidence intervals will be obtained if too few number of bootstrap replicates are used. Therefore, the function boot.ci will throw warnings and errors if bootstrap replicates are too few. Consider increasing the number of bootstrap replicates to at least 200.
The "bca" interval is often cited as the best for theoretical reasons, however it may produce unstable results if the bootstrap distribution is skewed or has extreme values. For example, you might get the warning "extreme order statistics used as endpoints" or the error "estimated adjustment 'a' is NA". In this case, you may want to use more bootstrap replicates or a different method or check your data for outliers.
The error "estimated adjustment 'w' is infinite" means that the estimated adjustment ‘w’ for the "bca" interval is infinite, which can happen when the empirical influence values are zero or very close to zero. This can be caused by various reasons, such as:
The number of bootstrap replicates is too small, the statistic of interest is constant or nearly constant across the bootstrap samples, the data contains outliers or extreme values.
You can try some possible solutions, such as:
Increasing the number of bootstrap replicates, using a different type of bootstrap confidence interval or removing or transforming the outliers or extreme values.
Parallelisation
If the parameter ncpus > 1, parallelisation is enabled. In Windows, parallel computing employs a "socket" approach that starts new copies of R on each core. POSIX systems, on the other hand (Mac, Linux, Unix, and BSD), utilise a "forking" approach that replicates the whole current version of R and transfers it to a new core.
Opening and terminating R sessions in each core involves a significant amount of processing time, therefore parallelisation in Windows machines is only quicker than not using parallelisation when nboots > 1000-2000.
Value
A dataframe containing population labels, heterozygosities, FIS, their standard deviations and sample sizes. When subsample.pop = TRUE (method='pop'), a named list with two elements: $subsample (the subsampling results for populations of at least n.limit individuals) and $results (the dataframe described above).
Author(s)
Author(s): Luis Mijangos, Carlo Pacioni. Custodian: Luis Mijangos – Post to https://groups.google.com/d/forum/dartr
References
Nei, M. (1978). Estimation of average heterozygosity and genetic distance from a small number of individuals. Genetics, 89(3), 583-590.
Schmidt, T. L., Jasper, M. E., Weeks, A. R., & Hoffmann, A. A. (2021). Unbiased population heterozygosity estimates from genome‐wide sequence data. Methods in Ecology and Evolution, 12(10), 1888-1898.
See Also
Other matched report:
gl.report.allna(),
gl.report.callrate(),
gl.report.contamination(),
gl.report.excess.het(),
gl.report.factorloadings(),
gl.report.fstat(),
gl.report.hamming(),
gl.report.hwe(),
gl.report.ld(),
gl.report.ld.map(),
gl.report.locmetric(),
gl.report.maf(),
gl.report.overshoot(),
gl.report.pa(),
gl.report.rdepth(),
gl.report.replicates(),
gl.report.replicates.KING(),
gl.report.reproducibility(),
gl.report.secondaries(),
gl.report.taglength()
Examples
require("dartR.data")
df <- gl.report.heterozygosity(platypus.gl)
df <- gl.report.heterozygosity(platypus.gl,method='ind')
n.inv <- gl.report.secondaries(platypus.gl)
gl.report.heterozygosity(platypus.gl, n.invariant = n.inv[7, 2])
gl.report.heterozygosity(platypus.gl, subsample.pop = TRUE)

if (isTRUE(getOption("dartR_fbm"))) platypus.gl <- gl.gen2fbm(platypus.gl)
df <- gl.report.heterozygosity(platypus.gl)
Reports departure from Hardy-Weinberg proportions
Description
Calculates the probabilities of agreement with H-W proportions based on observed frequencies of reference homozygotes, heterozygotes and alternate homozygotes.
Usage
gl.report.hwe(
  x,
  subset = "each",
  method_sig = "Exact",
  multi_comp = FALSE,
  multi_comp_method = "BY",
  alpha_val = 0.05,
  pvalue_type = "midp",
  cc_val = 0.5,
  direction = "both",
  min.hobs = 0,
  sig_only = TRUE,
  min_sample_size = 5,
  plot.out = TRUE,
  plot_colors = gl.colors("2c"),
  max_plots = 4,
  save2tmp = FALSE,
  verbose = NULL
)
Arguments
x |
Name of the genlight object containing the SNP data [required]. |
subset |
Whether to perform H-W tests within each population ("each"), or taking all individuals as one population ("all") (see details) [default 'each']. |
method_sig |
Method for determining statistical significance: 'ChiSquare' or 'Exact' [default 'Exact']. |
multi_comp |
Whether to adjust p-values for multiple comparisons [default FALSE]. |
multi_comp_method |
Method to adjust p-values for multiple comparisons: 'holm', 'hochberg', 'hommel', 'bonferroni', 'BH', 'BY', 'fdr' (see details) [default 'fdr']. |
alpha_val |
Level of significance for testing [default 0.05]. |
pvalue_type |
Type of p-value to be used in the Exact method. Either 'dost','selome','midp' (see details) [default 'midp']. |
cc_val |
The continuity correction applied to the ChiSquare test [default 0.5]. |
direction |
Restrict reporting to loci departing from Hardy-Weinberg proportions in a particular direction: 'both' (any departure), 'excess' (heterozygote excess, i.e. observed heterozygotes exceed Hardy-Weinberg expectation) or 'deficit' (heterozygote deficit) [default 'both']. |
min.hobs |
Restrict testing to loci with observed heterozygosity greater than or equal to this proportion; 0 disables the screen. The screen is applied before any adjustment for multiple comparisons, so it also confines the adjustment to the screened loci [default 0]. |
sig_only |
Whether the returned table should include loci with a significant departure from Hardy-Weinberg proportions [default TRUE]. |
min_sample_size |
Minimum number of individuals per population in which perform H-W tests [default 5]. |
plot.out |
If TRUE, will produce Ternary Plot(s) [default TRUE]. |
plot_colors |
Vector with two color names for the significant and not-significant loci [default gl.colors("2c")]. |
max_plots |
Maximum number of plots to print per page [default 4]. |
save2tmp |
If TRUE, saves any ggplots and listings to the session temporary directory (tempdir) [default FALSE]. |
verbose |
Verbosity: 0, silent or fatal errors; 1, begin and end; 2, progress log ; 3, progress and results summary; 5, full report [default NULL, adopting the global verbosity set by gl.set.verbosity(), or 2 if no global is set]. |
Details
There are several factors that can cause deviations from Hardy-Weinberg proportions including: mutation, finite population size, selection, population structure, age structure, assortative mating, sex linkage, nonrandom sampling and genotyping errors. Therefore, testing for Hardy-Weinberg proportions should be a process that involves a careful evaluation of the results, a good place to start is Waples (2015). Note that tests for H-W proportions are only valid if there is no population substructure (assuming random mating) and have sufficient power only when there is sufficient sample size (n individuals > 15). Populations can be defined in three ways:
Merging all populations in the dataset using subset = 'all'.
Within each population separately using: subset = 'each'.
Within selected populations using for example: subset = c('pop1','pop2').
Two different statistical methods to test for deviations from Hardy Weinberg proportions:
The classical chi-square test (method_sig='ChiSquare') based on the function
HWChisqof the R package HardyWeinberg. By default a continuity correction is applied (cc_val=0.5). The continuity correction can be turned off (by specifying cc_val=0), for example in cases of extreme allele frequencies in which the continuity correction can lead to excessive type 1 error rates.The exact test (method_sig='Exact') based on the exact calculations contained in the function
HWExactStatsof the R package HardyWeinberg, and described in Wigginton et al. (2005). The exact test is recommended in most cases (Wigginton et al., 2005). Three different methods to estimate p-values (pvalue_type) in the Exact test can be used:'dost' p-value is computed as twice the tail area of a one-sided test.
'selome' p-value is computed as the sum of the probabilities of all samples less or equally likely as the current sample.
'midp', p-value is computed as half the probability of the current sample + the probabilities of all samples that are more extreme.
The standard exact p-value is overly conservative, in particular for small minor allele frequencies. The mid p-value ameliorates this problem by bringing the rejection rate closer to the nominal level, at the price of occasionally exceeding the nominal level (Graffelman & Moreno, 2013).
Correction for multiple tests can be applied using the following methods
based on the function p.adjust:
'holm' is also known as the sequential Bonferroni technique (Rice, 1989). This method has a greater statistical power than the standard Bonferroni test, however this method becomes very stringent when many tests are performed and many real deviations from the null hypothesis can go undetected (Waples, 2015).
'hochberg' based on Hochberg, 1988.
'hommel' based on Hommel, 1988. This method is more powerful than Hochberg's, but the difference is usually small.
'bonferroni' in which p-values are multiplied by the number of tests. This method is very stringent and therefore has reduced power to detect multiple departures from the null hypothesis.
'BH' based on Benjamini & Hochberg, 1995.
'BY' based on Benjamini & Yekutieli, 2001.
The first four methods are designed to give strong control of the family-wise
error rate. The last two methods control the false discovery rate (FDR),
the expected proportion of false discoveries among the rejected hypotheses.
The false discovery rate is a less stringent condition than the family-wise
error rate, so these methods are more powerful than the others, especially
when number of tests is large.
The number of tests on which the adjustment for multiple comparisons is
the number of populations times the number of loci.
Heterozygote excess and deficit
Loci with a significant excess of heterozygotes are candidate sex-linked or
paralogous (collapsed duplicate) loci (Robledo-Ruiz et al., 2023); loci with
a heterozygote deficit can indicate null alleles, inbreeding or population
substructure (Wahlund effect). Setting direction='excess' (or 'deficit')
restricts the report to loci whose observed heterozygote count exceeds
(falls below) the Hardy-Weinberg expectation, which is included in the
output as the column Het.exp. To reproduce the workflow of the deprecated
gl.report.excess.het() (Robledo-Ruiz et al., 2023), use:
direction='excess', min.hobs=0.5, method_sig='ChiSquare', multi_comp=TRUE,
multi_comp_method='fdr' (cc_val=0.5 corresponds to Yates=TRUE, cc_val=0 to
Yates=FALSE). The min.hobs=0.5 screen — testing only loci with observed
heterozygosity of at least 0.5 — is an integral part of that published
workflow: it targets the strong-excess loci characteristic of sex linkage
and confines the false-discovery-rate adjustment to the screened set.
Ternary plots
Ternary plots can be used to visualise patterns of H-W proportions (plot.out
= TRUE). P-values and the statistical (non)significance of a large number of
bi-allelic markers can be inferred from their position in a ternary plot.
See Graffelman & Morales-Camarena (2008) for further details. Ternary plots
are based on the function HWTernaryPlot from
the package HardyWeinberg. Each vertex of the Ternary plot represents one of
the three possible genotypes for SNP data: homozygous for the reference
allele (AA), heterozygous (AB) and homozygous for the alternative allele
(BB). Loci deviating significantly from Hardy-Weinberg proportions after
correction for multiple tests are shown in pink. The blue parabola
represents Hardy-Weinberg equilibrium, and the area between green lines
represents the acceptance region.
For these plots to work it is necessary to install the package ggtern.
Value
A dataframe containing loci, counts of reference SNP homozygotes, heterozygotes and alternate SNP homozygotes; the expected heterozygote count under Hardy-Weinberg proportions (Het.exp); probability of departure from H-W proportions and per locus significance with and without correction for multiple comparisons. When sig_only = TRUE the table also carries npop, the number of populations in which the same locus is significantly out of HWE. Rows with a probability exactly equal to alpha_val carry NA in the significance columns.
Author(s)
Author(s): Luis Mijangos. Custodian: Luis Mijangos – Post to https://groups.google.com/d/forum/dartr
References
Benjamini, Y., and Yekutieli, D. (2001). The control of the false discovery rate in multiple testing under dependency. Annals of Statistics, 29, 1165–1188.
Graffelman, J. (2015). Exploring Diallelic Genetic Markers: The Hardy Weinberg Package. Journal of Statistical Software 64:1-23.
Graffelman, J. & Morales-Camarena, J. (2008). Graphical tests for Hardy-Weinberg equilibrium based on the ternary plot. Human Heredity 65:77-84.
Graffelman, J., & Moreno, V. (2013). The mid p-value in exact tests for Hardy-Weinberg equilibrium. Statistical applications in genetics and molecular biology, 12(4), 433-448.
Hochberg, Y. (1988). A sharper Bonferroni procedure for multiple tests of significance. Biometrika, 75, 800–803.
Hommel, G. (1988). A stagewise rejective multiple test procedure based on a modified Bonferroni test. Biometrika, 75, 383–386.
Rice, W. R. (1989). Analyzing tables of statistical tests. Evolution, 43(1), 223-225.
Robledo-Ruiz, D. A., Austin, L., Amos, J. N., Castrejon-Figueroa, J., Harley, D. K., Magrath, M. J., Sunnucks, P. & Pavlova, A. (2023). Easy-to-use R functions to separate reduced-representation genomic datasets into sex-linked and autosomal loci, and conduct sex assignment. Molecular Ecology Resources.
Waples, R. S. (2015). Testing for Hardy–Weinberg proportions: have we lost the plot?. Journal of heredity, 106(1), 1-19.
Wigginton, J.E., Cutler, D.J., & Abecasis, G.R. (2005). A Note on Exact Tests of Hardy-Weinberg Equilibrium. American Journal of Human Genetics 76:887-893.
See Also
Other matched report:
gl.report.allna(),
gl.report.callrate(),
gl.report.contamination(),
gl.report.excess.het(),
gl.report.factorloadings(),
gl.report.fstat(),
gl.report.hamming(),
gl.report.heterozygosity(),
gl.report.ld(),
gl.report.ld.map(),
gl.report.locmetric(),
gl.report.maf(),
gl.report.overshoot(),
gl.report.pa(),
gl.report.rdepth(),
gl.report.replicates(),
gl.report.replicates.KING(),
gl.report.reproducibility(),
gl.report.secondaries(),
gl.report.taglength()
Calculates pairwise linkage disequilibrium across all loci, pooled over all individuals
Description
This function calculates pairwise LD for every pair of loci, with all
individuals in the dataset pooled (populations are NOT analysed
separately; for within-population LD use
gl.report.ld.map).
The computation can be spread over multiple cores and, when
save = TRUE, intermediate chunks are written to outpath so
a crashed run can be restarted where it stopped by rerunning the same
command with the same chunkname. Before running the function,
it is advisable to use the function gl.filter.allna to
remove loci with all missing data.
Usage
gl.report.ld(
  x,
  name = NULL,
  save = TRUE,
  outpath = tempdir(),
  nchunks = 2,
  ncores = 1,
  chunkname = NULL,
  probar = FALSE,
  verbose = NULL
)
Arguments
x |
A genlight object containing the SNP data [required]. |
name |
Character string for the rdata file holding the results. If not given, "LDallp" is used [default NULL]. |
save |
Switch if results and intermediate chunks are saved to files [default TRUE]. |
outpath |
Folder where chunks and results are saved (if save=TRUE) [default tempdir()]. |
nchunks |
How many subchunks will be used (the less the faster, but if the routine crashes more bits are lost) [default 2]. |
ncores |
How many cores should be used [default 1]. |
chunkname |
The name of the chunks for saving [default NULL]. |
probar |
if TRUE, a progress bar is displayed for long loops [default FALSE]. |
verbose |
Verbosity: 0, silent or fatal errors; 1, begin and end; 2, progress log; 3, progress and results summary; 5, full report [default NULL, adopting the global verbosity set by gl.set.verbosity(), or 2 if no global is set]. |
Value
A data frame with pairwise LD statistics (D, D', r, R2, n, X2, p) for every pair of loci, computed over all individuals pooled. (See ?LD in package genetics for details on the statistics.)
Author(s)
Author(s): Bernd Gruber. Custodian: Bernd Gruber – Post to https://groups.google.com/d/forum/dartr
See Also
Other matched report:
gl.report.allna(),
gl.report.callrate(),
gl.report.contamination(),
gl.report.excess.het(),
gl.report.factorloadings(),
gl.report.fstat(),
gl.report.hamming(),
gl.report.heterozygosity(),
gl.report.hwe(),
gl.report.ld.map(),
gl.report.locmetric(),
gl.report.maf(),
gl.report.overshoot(),
gl.report.pa(),
gl.report.rdepth(),
gl.report.replicates(),
gl.report.replicates.KING(),
gl.report.reproducibility(),
gl.report.secondaries(),
gl.report.taglength()
Calculates pairwise linkage disequilibrium by population
Description
This function calculates pairwise linkage disequilibrium (LD) by population
using the function ld from package snpStats.
If SNPs are mapped to a reference genome, the information for the SNP's
position should be stored in the genlight accessor "@position" and the
SNP's chromosome name in the accessor "@chromosome" (see examples). The
function will then calculate LD within each chromosome and for all possible
SNP pair combinations within a distance of ld.max.pairwise.
If SNPs are not mapped to a reference genome (the "@chromosome" accessor
is empty), the function will assign the same chromosome ("1") to all the
SNPs in the dataset, assign a sequence from 1 to n loci as the position of
each SNP, and calculate LD for all possible SNP pair combinations. Setting
ld.max.pairwise = NULL forces this all-pairs behaviour even when
chromosome information is present.
Usage
gl.report.ld.map(
  x,
  ld.max.pairwise = 1e+06,
  maf = 0.05,
  ld.stat = "R.squared",
  ind.limit = 10,
  stat.keep = "AvgPIC",
  ld.threshold.pops = 0.2,
  plot.display = TRUE,
  plot.theme = theme_dartR(),
  plot.file = NULL,
  plot.dir = NULL,
  histogram.colors = NULL,
  boxplot.colors = NULL,
  bins = 50,
  verbose = NULL
)
Arguments
x |
Name of the genlight object containing the SNP data [required]. |
ld.max.pairwise |
Maximum distance in number of base pairs at which LD should be calculated [default 1000000]. |
maf |
Minor allele frequency (by population) threshold to filter out loci. If a value > 1 is provided it will be interpreted as MAC (i.e. the minimum number of times an allele needs to be observed) [default 0.05]. |
ld.stat |
The LD measure to be calculated: "LLR", "OR", "Q", "Covar", "D.prime", "R.squared", and "R". See function ld from snpstats (package snpStats) for details [default "R.squared"]. |
ind.limit |
Number of individuals a population must exceed to be
included in the analysis; populations with |
stat.keep |
Name of the column from the slot |
ld.threshold.pops |
LD threshold to report in the plot of "Number of populations in which the same SNP pair are in LD" [default 0.2]. |
plot.display |
If TRUE, the resultant plots are displayed in the plot window [default TRUE]. |
plot.theme |
Theme for the plot. See Details for options [default theme_dartR()]. |
plot.file |
Name for the RDS binary file to save (base name only, exclude extension) [default NULL] |
plot.dir |
Directory to save the plot RDS files [default as specified by the global working directory or tempdir()] |
histogram.colors |
Vector with two color names for the borders and fill [default NULL]. |
boxplot.colors |
A color palette for box plots by population or a list with as many colors as there are populations in the dataset [default NULL]. |
bins |
Number of bins to display in histograms [default 50]. |
verbose |
Verbosity: 0, silent or fatal errors; 1, begin and end; 2, progress log; 3, progress and results summary; 5, full report [default 2, unless specified using gl.set.verbosity]. |
Details
This function reports LD between SNP pairs by population.
The function gl.filter.ld filters out the SNPs in LD using as
input the results of gl.report.ld.map. The actual number of
SNPs to be filtered out depends on the parameters set in the function
gl.filter.ld.
Only SNP pairs with a positive value of the chosen statistic are reported;
pairs with a zero or negative value (possible for the signed statistics
"R", "Covar" and "Q") are omitted from the report and the plots. Within
each chromosome, loci sharing the same map position are represented by the
first of them; the others are excluded from the analysis (a message
reports the exclusions).
Boxplots of LD by population and
a histogram showing LD frequency are presented.
Value
A dataframe with information for each SNP pair in LD.
Author(s)
Author(s): Luis Mijangos. Custodian: Luis Mijangos – Post to https://groups.google.com/d/forum/dartr
See Also
Other matched report:
gl.report.allna(),
gl.report.callrate(),
gl.report.contamination(),
gl.report.excess.het(),
gl.report.factorloadings(),
gl.report.fstat(),
gl.report.hamming(),
gl.report.heterozygosity(),
gl.report.hwe(),
gl.report.ld(),
gl.report.locmetric(),
gl.report.maf(),
gl.report.overshoot(),
gl.report.pa(),
gl.report.rdepth(),
gl.report.replicates(),
gl.report.replicates.KING(),
gl.report.reproducibility(),
gl.report.secondaries(),
gl.report.taglength()
Examples
require("dartR.data")
if (isTRUE(getOption("dartR_fbm"))) platypus.gl <- gl.gen2fbm(platypus.gl)
x <- platypus.gl
x <- gl.filter.callrate(x,threshold = 1)
x <- gl.filter.monomorphs(x)
x$position <- x$other$loc.metrics$ChromPos_Platypus_Chrom_NCBIv1
x$chromosome <- as.factor(x$other$loc.metrics$Chrom_Platypus_Chrom_NCBIv1)
ld_res <- gl.report.ld.map(x,ld.max.pairwise = 10000000)
Reports summary of the slot $other$loc.metrics
Description
This function reports summary statistics (mean, minimum, average, quantiles), histograms
and boxplots for any loc.metric with numeric values (stored in
$other$loc.metrics) to assist the decision of choosing thresholds for the filter
function gl.filter.locmetric.
Usage
gl.report.locmetric(
  x,
  metric,
  plot.display = TRUE,
  plot.theme = theme_dartR(),
  plot.colors = NULL,
  plot.dir = NULL,
  plot.file = NULL,
  verbose = NULL
)
Arguments
x |
Name of the genlight object containing the SNP or presence/absence (SilicoDArT) data [required]. |
metric |
Name of the metric to be used for filtering [required]. |
plot.display |
Specify if plot is to be produced [default TRUE]. |
plot.theme |
User specified theme [default theme_dartR()]. |
plot.colors |
Vector with two color names for the borders and fill [default c("#2171B5", "#6BAED6")]. |
plot.dir |
Directory to save the plot RDS files [default as specified by the global working directory or tempdir()] |
plot.file |
Filename (minus extension) for the RDS plot file [Required for plot save] |
verbose |
Verbosity: 0, silent or fatal errors; 1, begin and end; 2, progress log; 3, progress and results summary; 5, full report [default NULL, adopting the global verbosity set by gl.set.verbosity(), or 2 if no global is set]. |
Details
The function gl.filter.locmetric will filter out the
loci with a locmetric value below a specified threshold.
The fields that are included in dartR, and a short description, are found
below. Optionally, the user can also set his/her own field by adding a vector
into $other$loc.metrics as shown in the example. You can check the names of
all available loc.metrics via: names(gl$other$loc.metrics).
SnpPosition - position (zero is position 1) in the sequence tag of the defined SNP variant base.
CallRate - proportion of samples for which the genotype call is non-missing (that is, not '-' ).
OneRatioRef - proportion of samples for which the genotype score is 0.
OneRatioSnp - proportion of samples for which the genotype score is 2.
FreqHomRef - proportion of samples homozygous for the Reference allele.
FreqHomSnp - proportion of samples homozygous for the Alternate (SNP) allele.
FreqHets - proportion of samples which score as heterozygous, that is, scored as 1.
PICRef - polymorphism information content (PIC) for the Reference allele.
PICSnp - polymorphism information content (PIC) for the SNP.
AvgPIC - average of the polymorphism information content (PIC) of the reference and SNP alleles.
AvgCountRef - sum of the tag read counts for all samples, divided by the number of samples with non-zero tag read counts, for the Reference allele row.
AvgCountSnp - sum of the tag read counts for all samples, divided by the number of samples with non-zero tag read counts, for the Alternate (SNP) allele row.
RepAvg - proportion of technical replicate assay pairs for which the marker score is consistent.
rdepth - read depth.
Function's output The minimum, maximum, mean and a tabulation of quantiles of the locmetric values against thresholds rate are provided. Output also includes a boxplot and a histogram. Quantiles are partitions of a finite set of values into q subsets of (nearly) equal sizes. In this function q = 20. Quantiles are useful measures because they are less susceptible to long-tailed distributions and outliers. Plot colours can be set with gl.select.colors(). If plot.file is specified, plots are saved to the directory specified by the user, or the global default working directory set by gl.set.wd() or to the tempdir(). Examples of other themes that can be used can be consulted in:
Value
An unaltered genlight object.
Author(s)
Author(s): Luis Mijangos. Custodian: Luis Mijangos (Post to https://groups.google.com/d/forum/dartr)
See Also
Other matched report:
gl.report.allna(),
gl.report.callrate(),
gl.report.contamination(),
gl.report.excess.het(),
gl.report.factorloadings(),
gl.report.fstat(),
gl.report.hamming(),
gl.report.heterozygosity(),
gl.report.hwe(),
gl.report.ld(),
gl.report.ld.map(),
gl.report.maf(),
gl.report.overshoot(),
gl.report.pa(),
gl.report.rdepth(),
gl.report.replicates(),
gl.report.replicates.KING(),
gl.report.reproducibility(),
gl.report.secondaries(),
gl.report.taglength()
Examples
# SNP data
if (isTRUE(getOption("dartR_fbm"))) testset.gl <- gl.gen2fbm(testset.gl)
out <- gl.report.locmetric(testset.gl,metric='SnpPosition')
# Tag P/A data
out <- gl.report.locmetric(testset.gs,metric='AvgReadDepth')
Reports minor allele frequency (MAF) for each locus in a SNP dataset
Description
This script provides summary histograms of MAF for each
population and an overall histogram to assist the decision of
choosing thresholds for the filter function gl.filter.maf
Usage
gl.report.maf(
  x,
  as.pop = NULL,
  maf.limit = 0.5,
  ind.limit = 5,
  plot.display = TRUE,
  plot.theme = theme_dartR(),
  plot.colors = NULL,
  plot.dir = NULL,
  plot.file = NULL,
  bins = 25,
  verbose = NULL
)
Arguments
x |
Name of the genlight object containing the SNP data [required]. |
as.pop |
Temporarily assign another individual metric as the population for the purposes of reporting [default NULL]. |
maf.limit |
Show histograms MAF range <= maf.limit [default 0.5]. |
ind.limit |
Show histograms only for populations of size greater than ind.limit [default 5]. |
plot.display |
Specify if plot is to be displayed in the graphics window [default TRUE]. |
plot.theme |
User specified theme [default theme_dartR()]. |
plot.colors |
Vector with color names for the borders and fill [default c("#2171B5", "#6BAED6")]. |
plot.dir |
Directory to save the plot RDS files [default as specified by the global working directory or tempdir()]. |
plot.file |
Filename (minus extension) for the RDS plot file [Required for plot save]. |
bins |
Number of bins to display in histograms [default 25]. |
verbose |
Verbosity: 0, silent or fatal errors; 1, begin and end; 2, progress log ; 3, progress and results summary; 5, full report [default 2 or as specified using gl.set.verbosity]. |
Details
The function gl.filter.maf will filter out the loci with MAF
below a specified threshold.
Function's output
The minimum, maximum, mean and a tabulation of MAF quantiles against thresholds rate are provided. Output also includes a boxplot and a histogram.
This function reports the MAF for each of several quantiles. Quantiles are partitions of a finite set of values into q subsets of (nearly) equal sizes. In this function q = 20. Quantiles are useful measures because they are less susceptible to long-tailed distributions and outliers.
Plot colours can be set with gl.select.colors().
If plot.file is specified, plots are saved to the directory specified by the user, or the global default working directory set by gl.set.wd() or to the tempdir().
Examples of other themes that can be used can be consulted in
Value
A dataframe (returned invisibly) of minor allele frequencies by locus (rows) and population (columns). The input genlight object is unaltered.
Author(s)
Author(s): Arthur Georges. Custodian: Arthur Georges (Post to https://groups.google.com/d/forum/dartr)
See Also
Other matched report:
gl.report.allna(),
gl.report.callrate(),
gl.report.contamination(),
gl.report.excess.het(),
gl.report.factorloadings(),
gl.report.fstat(),
gl.report.hamming(),
gl.report.heterozygosity(),
gl.report.hwe(),
gl.report.ld(),
gl.report.ld.map(),
gl.report.locmetric(),
gl.report.overshoot(),
gl.report.pa(),
gl.report.rdepth(),
gl.report.replicates(),
gl.report.replicates.KING(),
gl.report.reproducibility(),
gl.report.secondaries(),
gl.report.taglength()
Examples
if (isTRUE(getOption("dartR_fbm"))) platypus.gl <- gl.gen2fbm(platypus.gl)
gl <- gl.filter.allna(platypus.gl)
gl.report.maf(gl)
Reports monomorphic loci
Description
This script reports the number of monomorphic loci and those with all NAs in a genlight {adegenet} object
Usage
gl.report.monomorphs(x, verbose = NULL)
Arguments
x |
Name of the input genlight object [required]. |
verbose |
Verbosity: 0, silent or fatal errors; 1, begin and end; 2, progress log; 3, progress and results summary; 5, full report [default NULL, unless specified using gl.set.verbosity]. |
Details
A DArT dataset will not have monomorphic loci, but they can arise, along with loci that are scored all NA, when populations or individuals are deleted. Retaining monomorphic loci unnecessarily increases the size of the dataset and will affect some calculations. Note that for SNP data, NAs likely represent null alleles; in tag presence/absence data, NAs represent missing values (presence/absence could not be reliably scored)
Value
An unaltered genlight object
Author(s)
Author(s): Arthur Georges. Custodian: Arthur Georges – Post to https://groups.google.com/d/forum/dartr
See Also
Other matched reports:
gl.report.bases()
Examples
# SNP data
if (isTRUE(getOption("dartR_fbm"))) testset.gl <- gl.gen2fbm(testset.gl)
  gl.report.monomorphs(testset.gl)
# SilicoDArT data
  gl.report.monomorphs(testset.gs)
Reports loci for which the SNP has been trimmed from the sequence tag along with the adaptor
Description
This function checks the position of the SNP within the trimmed sequence tag and identifies those for which the SNP position is outside the trimmed sequence tag. This can happen, rarely, when the sequence containing the SNP resembles the adaptor.
Usage
gl.report.overshoot(x, verbose = NULL)
Arguments
x |
Name of the genlight object [required]. |
verbose |
Verbosity: 0, silent or fatal errors; 1, begin and end; 2, progress log; 3, progress and results summary; 5, full report [default NULL, adopting the global verbosity set by gl.set.verbosity(), or 2 if no global is set]. |
Details
The SNP genotype can still be used in most analyses, but functions like gl2fasta() will present challenges if the SNP has been trimmed from the sequence tag.
Value
An unaltered genlight object
Author(s)
Author(s): Arthur Georges. Custodian: Arthur Georges – Post to https://groups.google.com/d/forum/dartr
See Also
Other matched report:
gl.report.allna(),
gl.report.callrate(),
gl.report.contamination(),
gl.report.excess.het(),
gl.report.factorloadings(),
gl.report.fstat(),
gl.report.hamming(),
gl.report.heterozygosity(),
gl.report.hwe(),
gl.report.ld(),
gl.report.ld.map(),
gl.report.locmetric(),
gl.report.maf(),
gl.report.pa(),
gl.report.rdepth(),
gl.report.replicates(),
gl.report.replicates.KING(),
gl.report.reproducibility(),
gl.report.secondaries(),
gl.report.taglength()
Examples
if (isTRUE(getOption("dartR_fbm"))) testset.gl <- gl.gen2fbm(testset.gl)
gl.report.overshoot(testset.gl)
Reports private alleles (and fixed alleles) per pair of populations
Description
This function reports private alleles in one population compared with a second population, for all populations taken pairwise. It also reports a count of fixed allelic differences and the mean absolute allele frequency differences (AFD) between pairs of populations.
Usage
gl.report.pa(
  x,
  x2 = NULL,
  method = "pairwise",
  loc.names = FALSE,
  test.asym = FALSE,
  test.asym.boot = 100,
  plot.display = FALSE,
  matrix.pa = FALSE,
  plot.font = 14,
  map.interactive = FALSE,
  provider = "Esri.NatGeoWorldMap",
  palette.discrete = NULL,
  plot.file = NULL,
  plot.dir = NULL,
  verbose = NULL
)
Arguments
x |
Name of the genlight object containing the SNP or SilicoDArT data [required]. |
x2 |
If two separate genlight objects are to be compared this can be provided here, but they must have the same number of SNPs [default NULL]. |
method |
Method to calculate private alleles: 'pairwise' comparison or compare each population against the rest 'one2rest' [default 'pairwise']. |
loc.names |
Whether names of loci with private alleles and fixed differences should be reported. If TRUE, loci names are reported using a list [default FALSE]. |
test.asym |
Bootstrap test for significant differences of private alleles (see details section) [default FALSE]. |
test.asym.boot |
Number of permutations [default 100]. |
plot.display |
Specify if Sankey plot is to be produced [default FALSE]. |
matrix.pa |
Whether to generate a matrix of private alleles [default FALSE]. |
plot.font |
Numeric font size in pixels for the node text labels [default 14]. |
map.interactive |
Specify whether an interactive map showing private alleles between populations is to be produced [default FALSE]. |
provider |
Passed to leaflet [default "Esri.NatGeoWorldMap"]. |
palette.discrete |
A discrete palette for the color of populations or a list with as many colors as there are populations in the dataset [default NULL, in which case gl.select.colors(x) is used]. |
plot.file |
Name for the RDS binary file to save (base name only, exclude extension) [default NULL] |
plot.dir |
Directory in which to save files [default = working directory] |
verbose |
Verbosity: 0, silent, fatal errors only; 1, flag function begin and end; 2, progress log; 3, progress and results summary; 5, full report [default 2 or as specified using gl.set.verbosity]. |
Details
Note that the number of paired alleles between two populations is not a symmetric dissimilarity measure.
If no x2 is provided, the function uses the pop(gl) hierarchy to determine pairs of populations, otherwise it runs a single comparison between x and x2.
Hint: in case you want to run comparisons between individuals (assuming individual names are unique), you can simply redefine your population names with your individual names, as below:
pop(gl) <- indNames(gl)
Definition of fixed and private alleles
The table below shows the possible cases of allele frequencies between two populations (0 = homozygote for Allele 1, x = both Alleles are present, 1 = homozygote for Allele 2).
p: cases where there is a private allele in pop1 compared to pop2 (but not viceversa)
f: cases where there is a fixed allele in pop1 (and pop2, as those cases are symmetric)
| pop1 | ||||
| 0 | x | 1 | ||
| 0 | - | p | p,f | |
| pop2 | x | - | - | - |
| 1 | p,f | p | - |
The absolute allele frequency difference (AFD) in this function is a simple differentiation metric displaying intuitive properties which provides a valuable alternative to FST. For details about its properties and how it is calculated see Berner (2019).
The test for asymmetry of private alleles (test.asym) is a permutation test: for each pair, the genotypes at each locus are permuted among the pooled individuals of the two populations (retaining the original sample sizes), and the ratio of private alleles pop1/(pop1 + pop2) is recomputed for each of test.asym.boot permutations. The reported significance is the proportion of permuted ratios exceeding the observed ratio. Available for SNP data only.
For method 'one2rest', the Chao estimates, the asymmetry test and the interactive map are not reported; they apply to method 'pairwise' only.
The function also reports an estimation of the lower bound of the number of undetected private alleles using the Good-Turing frequency formula, originally developed for cryptography, which estimates in an ecological context the true frequencies of rare species in a single assemblage based on an incomplete sample of individuals. The approach is described in Chao et al. (2017). For this function, equation 2c is used, based on the counts of private alleles observed once and twice in the pooled sample of the two populations compared. The estimate is reported in the output table as Chao1 and Chao2 (SNP data only).
In this function a Sankey Diagram is used to visualize patterns of private alleles between populations. This diagram allows to display flows (private alleles) between nodes (populations). Their links are represented with arcs that have a width proportional to the importance of the flow (number of private alleles).
Value
A data.frame. Each row shows, for each pair of populations the number of individuals in each population, the number of loci with fixed differences (same for both populations) in pop1 (compared to pop2) and viceversa. Same for private alleles and finally the absolute mean allele frequency difference between loci (AFD). If loc.names = TRUE, loci names with private alleles and fixed differences are reported in a list in addition to the dataframe.
Author(s)
Author(s): Bernd Gruber. Custodian: Bernd Gruber – Post to https://groups.google.com/d/forum/dartr
References
Berner, D. (2019). Allele frequency difference AFD – an intuitive alternative to FST for quantifying genetic population differentiation. Genes, 10(4), 308.
Chao, Anne, et al. "Deciphering the enigma of undetected species, phylogenetic, and functional diversity based on Good-Turing theory." Ecology 98.11 (2017): 2914-2929.
See Also
Other matched report:
gl.report.allna(),
gl.report.callrate(),
gl.report.contamination(),
gl.report.excess.het(),
gl.report.factorloadings(),
gl.report.fstat(),
gl.report.hamming(),
gl.report.heterozygosity(),
gl.report.hwe(),
gl.report.ld(),
gl.report.ld.map(),
gl.report.locmetric(),
gl.report.maf(),
gl.report.overshoot(),
gl.report.rdepth(),
gl.report.replicates(),
gl.report.replicates.KING(),
gl.report.reproducibility(),
gl.report.secondaries(),
gl.report.taglength()
Examples
if (isTRUE(getOption("dartR_fbm"))) platypus.gl <- gl.gen2fbm(platypus.gl)
out <- gl.report.pa(platypus.gl)
Reports observed, expected and unbiased heterozygosities and FIS (inbreeding coefficient) by population or by individual from polyploid (dosage) SNP data
Description
Calculates the observed (gametic), expected and unbiased
expected (i.e. corrected for sample size) heterozygosities and FIS
(inbreeding coefficient) for each population, or the observed
heterozygosity for each individual, in a genlight object coded as allele
dosages. For diploid data the results equal those of
gl.report.heterozygosity.
Usage
gl.report.polyploid_heterozygosity(
  x,
  method = "pop",
  n.invariant = 0,
  subsample.pop = FALSE,
  n.limit = 10,
  nboots = 0,
  conf = 0.95,
  CI.type = "bca",
  ncpus = 1,
  plot.display = TRUE,
  plot.theme = theme_dartR(),
  plot.colors.pop = gl.colors("dis"),
  plot.colors.ind = gl.colors(2),
  plot.file = NULL,
  plot.dir = NULL,
  error.bar = "SD",
  verbose = NULL
)
Arguments
x |
Name of the genlight object containing SNP data coded as dosages
(0 to k copies of the alternative allele, where k is the ploidy), for
example read with |
method |
Calculate heterozygosity by population (method='pop') or by individual (method='ind') [default 'pop']. |
n.invariant |
An estimate of the number of invariant sequence tags used to adjust the heterozygosity rate [default 0]. |
subsample.pop |
Whether subsample populations to estimate observed heterozygosity (see Details) [default FALSE]. |
n.limit |
Minimum number of individuals that should have a population to perform subsampling to estimate heterozygosity [default 10]. |
nboots |
Number of bootstrap replicates to obtain confidence intervals [default 0]. |
conf |
The confidence level of the required interval [default 0.95]. |
CI.type |
Method to estimate confidence intervals. One of "norm", "basic", "perc" or "bca" [default "bca"]. |
ncpus |
Number of processes to be used in parallel operation. If ncpus > 1 parallel operation is activated, see "Details" section [default 1]. |
plot.display |
Specify if plot is to be produced [default TRUE]. |
plot.theme |
Theme for the plot. See Details for options [default theme_dartR()]. |
plot.colors.pop |
A color palette for population plots or a list with as many colors as there are populations in the dataset [default gl.colors("dis")]. |
plot.colors.ind |
List of two color names for the borders and fill of the plot by individual [default gl.colors(2)]. |
plot.file |
Name for the RDS binary file to save (base name only, exclude extension) [default NULL]. |
plot.dir |
Directory to save the plot RDS files [default as specified by the global working directory or tempdir()]. |
error.bar |
Statistic to be plotted as error bar either "SD" (standard deviation) or "SE" (standard error) or "CI" (confidence intervals) [default "SD"]. |
verbose |
Verbosity: 0, silent or fatal errors; 1, begin and end; 2, progress log; 3, progress and results summary; 5, full report [default NULL, unless specified using gl.set.verbosity]. |
Details
Observed heterozygosity is the gametic heterozygosity: for an individual of ploidy k carrying d copies of the alternative allele, the probability that two allele copies drawn without replacement differ, d(k - d) / choose(k, 2) (Moody et al. 1993). For diploids this is 1 for a heterozygote and 0 for a homozygote. Observed heterozygosity for a population averages it over the individuals scored at each locus and then over loci. The calculations take into account missing values.
Expected heterozygosity for a population takes the expected proportion of heterozygotes, that is, expected under Hardy-Weinberg equilibrium, for each locus, then averages this across the loci for an average estimate for the population.
The unbiased expected heterozygosity is calculated using the correction for sample size following equation 2 from Nei 1978.
Accuracy of all heterozygosity estimates is affected by small sample sizes, and so is their comparison between populations or repeated analysis. Expected heterozygosities are less affected because their calculations are based on allele frequencies while observed heterozygosities are strongly susceptible to sampling effects when the sample size is small.
Observed heterozygosity for individuals is the gametic heterozygosity averaged over the loci scored for that individual. The output also gives the proportions of loci homozygous for the reference allele (dosage 0) and for the alternative allele (dosage k).
Finally, the loci that are invariant across all individuals in the dataset
(that is, across populations), is typically unknown. This can render
estimates of heterozygosity analysis specific, and so it is not valid to
compare such estimates across species or even across different analyses
(see Schmidt et al 2021). This is a similar problem faced by microsatellites.
If you have an estimate of the
number of invariant sequence tags (loci) in your data, such as provided by
gl.report.secondaries, you can specify it with the n.invariant
parameter to standardize your estimates of heterozygosity. This is called
autosomal heterozygosities by Schmidt et al (2021).
NOTE: It is important to realise that estimation of adjusted (autosomal) heterozygosity requires that secondaries not to be removed.
Heterozygosities and FIS (inbreeding coefficient) are calculated by locus within each population using the following equations, and then averaged across all loci:
Observed heterozygosity (Ho) = mean over individuals of d(k - d) / choose(k, 2), where d is the dosage and k the ploidy.
Observed heterozygosity adjusted (Ho.adj) <- Ho * n_Loc / (n_Loc + n.invariant), where n_Loc is the number of loci that do not have all missing data and n.invariant is an estimate of the number of invariant loci to adjust heterozygosity.
Expected heterozygosity (He) = 1 - (p^2 + q^2), where q, the frequency of the alternative allele, is the sum of dosages divided by the number of sampled allele copies (the sum of ploidies of the individuals scored at that locus), and p = 1 - q.
Expected heterozygosity adjusted (He.adj) = He * n_Loc / (n_Loc + n.invariant)
Unbiased expected heterozygosity (uHe) = He * N / (N - 1), where N is the number of sampled allele copies at that locus (2 * n_Ind for diploids)
Inbreeding coefficient (FIS) = 1 - Ho / uHe
Function's output
Output for method='pop' is an ordered barchart of observed heterozygosity, unbiased expected heterozygosity and FIS (Inbreeding coefficient) across populations together with a table of mean observed and expected heterozygosities and FIS by population and their respective standard deviations (SD). In the output, it is also reported by population: the number of loci used to estimate heterozygosity (n.Loc), the number of polymorphic loci (polyLoc), the number of monomorphic loci (monoLoc) and loci with all missing data (all_NALoc).
Output for method='ind' is a histogram and a boxplot of heterozygosity across individuals.
If a plot.file is given, the ggplot arising from this function is saved as an "RDS" binary file using saveRDS(); can be reloaded with readRDS(). A file name must be specified for the plot to be saved.
If a plot directory (plot.dir) is specified, the ggplot binary is saved to that directory; otherwise to the tempdir(). Nothing is saved when plot.display = FALSE (or verbose = 0), as no plot is built.
Examples of other themes that can be used can be consulted in:
Subsampling populations
Subsampling applies to method = 'pop' only; it is ignored, with a warning, for method = 'ind'. To test the effect of five population sample sizes (n = 10, 5, 4, 3, 2) on observed heterozygosity estimates, the function subsamples individuals, without replacement. The subsampling is repeated 10 times for each sample size n. This approach is an implementation of Schmidt et al (2021).
Error bars
The best method for presenting or assessing genetic statistics depends on the type of data you have and the specific questions you're trying to answer. Here's a brief overview of when you might use each method:
1. Confidence Intervals ("CI"):
- Usage: Often used to convey the precision of an estimate.
- Advantage: Confidence intervals give a range in which the true parameter (like a population mean) is likely to fall, given the data and a specified probability (like 95%).
- In Context: For genetic statistics, if you're estimating a parameter, a 95% CI gives you a range in which you're 95% confident the true parameter lies.
2. Standard Deviation ("SD"):
- Usage: Describes the amount of variation from the average in a set of data.
- Advantage: Allows for an understanding of the spread of individual data points around the mean.
- In Context: If you're looking at the distribution of a quantitative trait (like height) in a population with a particular genotype, the SD can describe how much individual heights vary around the average height.
3. Standard Error ("SE"):
- Usage: Describes the precision of the sample mean as an estimate of the population mean.
- Advantage: Smaller than the SD in large samples; it takes into account both the SD and the sample size.
- In Context: If you want to know how accurately your sample mean represents the population mean, you'd look at the SE.
Recommendation:
- If you're trying to convey the precision of an estimate, confidence intervals are very useful.
- For understanding variability within a sample, standard deviation is key.
- To see how well a sample mean might estimate a population mean, consider the standard error.
Confidence Intervals
The uncertainty of a parameter, in this case the mean of the statistic, can be summarised by a confidence interval (CI) which includes the true parameter value with a specified probability (i.e. confidence level; the parameter "conf" in this function).
In this function, CI are obtained using Bootstrap which is an inference method that samples loci with replacement and calculates the statistics every time.
This function uses the function boot (package boot) to perform the bootstrap replicates and the function boot.ci (package boot) to perform the calculations for the CI.
Four different types of nonparametric CI can be calculated (parameter "CI.type" in this function):
First order normal approximation interval ("norm").
Basic bootstrap interval ("basic").
Bootstrap percentile interval ("perc").
Adjusted bootstrap percentile interval ("bca").
The studentized bootstrap interval ("stud") was not included in the CI types because it is computationally intensive, it may produce estimates outside the range of plausible values and it has been found to be erratic in practice, see for example the "Studentized (t) Intervals" section in:
https://www.r-bloggers.com/2019/09/understanding-bootstrap-confidence-interval-output-from-the-r-boot-package
Nice tutorials about the different types of CI can be found in:
https://www.datacamp.com/tutorial/bootstrap-r
and
https://www.r-bloggers.com/2019/09/understanding-bootstrap-confidence-interval-output-from-the-r-boot-package
Efron and Tibshirani (1993, p. 162) and Davison and Hinkley (1997, p. 194) suggest that the number of bootstrap replicates should be between 1000 and 2000.
It is important to note that unreliable confidence intervals will be obtained if too few number of bootstrap replicates are used. Therefore, the function boot.ci will throw warnings and errors if bootstrap replicates are too few. Consider increasing the number of bootstrap replicates to at least 200.
The "bca" interval is often cited as the best for theoretical reasons, however it may produce unstable results if the bootstrap distribution is skewed or has extreme values. For example, you might get the warning "extreme order statistics used as endpoints" or the error "estimated adjustment 'a' is NA". In this case, you may want to use more bootstrap replicates or a different method or check your data for outliers.
The error "estimated adjustment 'w' is infinite" means that the estimated adjustment ‘w’ for the "bca" interval is infinite, which can happen when the empirical influence values are zero or very close to zero. This can be caused by various reasons, such as:
The number of bootstrap replicates is too small, the statistic of interest is constant or nearly constant across the bootstrap samples, the data contains outliers or extreme values.
You can try some possible solutions, such as:
Increasing the number of bootstrap replicates, using a different type of bootstrap confidence interval or removing or transforming the outliers or extreme values.
Parallelisation
If the parameter ncpus > 1, parallelisation is enabled. In Windows, parallel computing employs a "socket" approach that starts new copies of R on each core. POSIX systems, on the other hand (Mac, Linux, Unix, and BSD), utilise a "forking" approach that replicates the whole current version of R and transfers it to a new core.
Opening and terminating R sessions in each core involves a significant amount of processing time, therefore parallelisation in Windows machines is only quicker than not using parallelisation when nboots > 1000-2000.
Value
For method = 'pop', a dataframe containing population labels,
heterozygosities, FIS, their standard deviations, standard errors,
confidence intervals (if nboots > 0) and sample sizes. For method = 'ind',
a dataframe with, per individual, Ho, the proportions of homozygous
reference and alternative loci, and the number of loci scored. With
subsample.pop = TRUE (method = 'pop'), a named list:
subsample, the subsampling results, and results, the
dataframe above.
Author(s)
Author(s): Ching Ching Lau. Custodian: Ching Ching Lau (Post to https://groups.google.com/d/forum/dartr)
References
Moody, M. E., Mueller, L. D., & Soltis, D. E. (1993). Genetic variation and random drift in autotetraploid populations. Genetics, 134(2), 649-657.
Nei, M. (1978). Estimation of average heterozygosity and genetic distance from a small number of individuals. Genetics, 89(3), 583-590.
Schmidt, T. L., Jasper, M., Weeks, A. R., & Hoffmann, A. A. (2021). Unbiased population heterozygosity estimates from genome-wide sequence data. Methods in Ecology and Evolution, 12(10), 1888-1898.
See Also
Other unmatched report:
gl.allele.freq(),
gl.report.allelerich(),
gl.report.basics(),
gl.report.diversity(),
gl.report.shannon()
Examples
# simulated autotetraploid: 20 individuals in two populations, 50 loci,
# dosages 0-4 copies of the alternative allele
set.seed(1)
q <- runif(50, 0.1, 0.9)
dos <- sapply(q, function(qq) rbinom(20, 4, qq))
rownames(dos) <- paste0("ind", 1:20)
colnames(dos) <- paste0("loc", 1:50)
tetra <- new("genlight", dos, ploidy = rep(4, 20))
pop(tetra) <- rep(c("A", "B"), each = 10)
tetra <- gl.compliance.check(tetra, verbose = 0)
res <- gl.report.polyploid_heterozygosity(tetra)
res_ind <- gl.report.polyploid_heterozygosity(tetra, method = "ind")
Reports summary of Read Depth for each locus
Description
SNP datasets generated by DArT report AvgCountRef and AvgCountSnp as counts of sequence tags for the reference and alternate alleles respectively. These can be used to back calculate Read Depth. Fragment presence/absence datasets as provided by DArT (SilicoDArT) provide Average Read Depth and Standard Deviation of Read Depth as standard columns in their report. This function reports the read depth by locus for each of several quantiles.
Usage
gl.report.rdepth(
  x,
  plot.display = TRUE,
  plot.theme = theme_dartR(),
  plot.colors = NULL,
  plot.dir = NULL,
  plot.file = NULL,
  verbose = NULL
)
Arguments
x |
Name of the genlight object containing the SNP or presence/absence (SilicoDArT) data [required]. |
plot.display |
Specify if plot is to be produced [default TRUE]. |
plot.theme |
User specified theme [default theme_dartR()]. |
plot.colors |
Vector with two color names for the borders and fill [default c("#2171B5", "#6BAED6")]. |
plot.dir |
Directory to save the plot RDS files [default as specified by the global working directory or tempdir()] |
plot.file |
Filename (minus extension) for the RDS plot file [Required for plot save] |
verbose |
Verbosity: 0, silent or fatal errors; 1, begin and end; 2, progress log; 3, progress and results summary; 5, full report [default NULL, adopting the global verbosity set by gl.set.verbosity(), or 2 if no global is set]. |
Details
The function displays a table of minimum, maximum, mean and quantiles for
read depth against possible thresholds that might subsequently be specified
in gl.filter.rdepth. If plot.display=TRUE, display also includes a
boxplot and a histogram to guide in the selection of a threshold for
filtering on read depth.
Plot colours can be set with gl.select.colors().
If plot.file is specified, plots are saved to the directory specified by the user, or the global
default working directory set by gl.set.wd() or to the tempdir().
For examples of themes, see
Value
An unaltered genlight object
Author(s)
Custodian: Arthur Georges. Author(s): Arthur Georges – Post to https://groups.google.com/d/forum/dartr
See Also
Other matched report:
gl.report.allna(),
gl.report.callrate(),
gl.report.contamination(),
gl.report.excess.het(),
gl.report.factorloadings(),
gl.report.fstat(),
gl.report.hamming(),
gl.report.heterozygosity(),
gl.report.hwe(),
gl.report.ld(),
gl.report.ld.map(),
gl.report.locmetric(),
gl.report.maf(),
gl.report.overshoot(),
gl.report.pa(),
gl.report.replicates(),
gl.report.replicates.KING(),
gl.report.reproducibility(),
gl.report.secondaries(),
gl.report.taglength()
Examples
# SNP data
if (isTRUE(getOption("dartR_fbm"))) testset.gl <- gl.gen2fbm(testset.gl)
gl <- gl.report.rdepth(testset.gl)
gl <- gl.report.rdepth(testset.gs)
Identify replicated individuals
Description
This function scans a genlight object for pairs of individuals that share a high proportion of identical genotype calls across a minimum number of jointly observed (non-missing) loci. It is intended to help detect technical replicates, sample duplicates, and other near-identical samples, and to suggest which individual to remove based on missing-data rate.
Usage
gl.report.replicates(
  x,
  loc_threshold = 100,
  perc_geno = 0.95,
  plot.out = TRUE,
  plot_theme = theme_dartR(),
  plot_colors = c("#2171B5", "#6BAED6"),
  bins = 100,
  verbose = NULL
)
Arguments
x |
Name of the genlight object containing the SNP data [required]. |
loc_threshold |
Minimum number of loci required to assess that two individuals are replicates [default 100]. |
perc_geno |
Minimum percentage of genotypes in which two individuals should be the same [default 0.95]. |
plot.out |
Specify if plot is to be produced [default TRUE]. |
plot_theme |
User specified theme [default theme_dartR()]. |
plot_colors |
Vector with two color names for the borders and fill [default c("#2171B5", "#6BAED6")]. |
bins |
Number of bins to display in histograms [default 100]. |
verbose |
Verbosity: 0, silent or fatal errors; 1, begin and end; 2, progress log; 3, progress and results summary; 5, full report [default 2, unless specified using gl.set.verbosity]. |
Details
What the function computes
The input is coerced to a numeric matrix. For every pair of
individuals i,j, the function counts:
'nloc' = the number of loci where both individuals have non-missing genotype calls (pairwise complete observations).
'nsame' = the number of those 'nloc' loci where the two genotype calls are identical.
'perc' = 'nsame / nloc', the proportion of identical genotype calls for that pair.
Pairs are reported as putative replicates/duplicates when both conditions hold: 'nloc > loc_threshold' and 'perc > perc_geno'.
How the computation is implemented
The pairwise counts ('nsame' and 'nloc') are computed with a C++ routine compiled at run time. This requires the Rcpp/RcppParallel packages. The first call in a session will be slower because the C++ code must be compiled; subsequent calls are fast.
A file-backed (FBM) object is read from its backing file in blocks of loci
and the pairwise counts are added block by block (serially), so the
genotype matrix is never decoded as a whole; the results are identical to
those of the same data held in memory. The pairwise counts and results
(nInd(x)^2 values) are held in memory.
Suggested individual to drop For each flagged pair, the function calculates per-individual missingness as the proportion of 'NA' genotypes across all loci. The replicate suggested for removal ('ind_to_drop') is the member of the pair with the higher missingness, so that the retained replicate maximises usable genotype information.
How to interpret the histograms When 'plot.out = TRUE', the function draws:
A histogram of 'perc' across *all* pairwise comparisons.
A zoomed histogram restricted to 'perc > 0.8' to resolve the upper tail.
In an ideal large dataset containing a mixture of unrelated and related individuals plus several replicated individuals (e.g., capture/mark/recapture), the first histogram often shows four approximate modes ('peaks'):
Unrelated pairs (lowest 'perc').
Second-degree relatives (e.g., cousins).
First-degree relatives (e.g., parent–offspring, full siblings).
Replicated/duplicate samples (highest 'perc', near 1).
To confidently separate true replicates from close relatives, the zoomed histogram should show a clear gap between the third and fourth peaks: one or more bins with zero counts between the close-relative peak and the replicate peak. If the close-relative and replicate distributions overlap (no zero-count gap), you should treat replicate calls as uncertain and consider increasing marker quality/quantity, tightening filters, or raising 'loc_threshold' and/or 'perc_geno'.
Value
A list with three elements (returned invisibly):
table.rep: A dataframe with pairwise results of percentage of same genotypes between two individuals, the number of loci used in the comparison and the missing data for each individual.
ind.list.drop: A vector of replicated individuals suggested for removal – for each pair, the member with the higher missing-data rate (ties drop the second-named individual).
ind.list.rep: A list of of each individual that has replicates in the dataset, the name of the replicates and the percentage of the same genotype.
Author(s)
Author(s): Luis Mijangos. Custodian: Luis Mijangos – Post to https://groups.google.com/d/forum/dartr
See Also
Other matched report:
gl.report.allna(),
gl.report.callrate(),
gl.report.contamination(),
gl.report.excess.het(),
gl.report.factorloadings(),
gl.report.fstat(),
gl.report.hamming(),
gl.report.heterozygosity(),
gl.report.hwe(),
gl.report.ld(),
gl.report.ld.map(),
gl.report.locmetric(),
gl.report.maf(),
gl.report.overshoot(),
gl.report.pa(),
gl.report.rdepth(),
gl.report.replicates.KING(),
gl.report.reproducibility(),
gl.report.secondaries(),
gl.report.taglength()
Examples
if (isTRUE(getOption("dartR_fbm"))) platypus.gl <- gl.gen2fbm(platypus.gl)
res_rep <- gl.report.replicates(platypus.gl, loc_threshold = 500,
perc_geno = 0.85)
Identifies duplicate samples by KING-robust kinship
Description
Scans a genlight object for duplicate samples (two libraries of one
animal) by KING-robust kinship and the heterozygote share, computed from
genotype likelihoods, read counts or called genotypes, and suggests which
sample of each group of duplicates to remove. Unlike the identity screen
of gl.report.replicates, it also finds duplicates in which
one sample is poor: missed heterozygotes in a poor sample lower the share
of identical genotypes, but much less so the kinship estimated from
likelihoods or the heterozygote share.
Usage
gl.report.replicates.KING(
  x,
  input = c("auto", "likelihoods", "counts", "calls"),
  error_rate = 0.001,
  maf = 0.05,
  loc_threshold = 100,
  king_threshold = 0.354,
  het_threshold = 0.8,
  plot.out = TRUE,
  plot_theme = theme_dartR(),
  plot_colors = c("#2171B5", "#6BAED6"),
  bins = 100,
  verbose = NULL
)
Arguments
x |
Name of the genlight object containing the SNP data [required]. |
input |
Data the kinship is computed from: "likelihoods" (the
genotype likelihoods kept by |
error_rate |
Sequencing error rate of the binomial likelihoods built from read counts; used only with read counts [default 0.001]. |
maf |
Minimum minor allele frequency of the loci used [default 0.05]. |
loc_threshold |
Minimum number of loci two samples must share for their pair to be assessed [default 100]. |
king_threshold |
KING-robust kinship above which a pair is a duplicate [default 0.354]. |
het_threshold |
Heterozygote share above which a pair is a duplicate; used only with called genotypes (see details) [default 0.80]. |
plot.out |
If TRUE, the plot is produced and returned; it is also printed unless verbose is 0 [default TRUE]. |
plot_theme |
User specified theme [default theme_dartR()]. |
plot_colors |
Vector with two colour names: flagged pairs and other pairs in the scatter plot, borders and fill of the histogram [default c("#2171B5", "#6BAED6")]. |
bins |
Number of bins of the histogram [default 100]. |
verbose |
Verbosity: 0, silent or fatal errors; 1, begin and end; 2, progress log; 3, progress and results summary; 5, full report [default 2, unless specified using gl.set.verbosity]. |
Details
Pair statistics
At each locus the genotypes of two samples (0, 1 or 2 copies of the ALT allele) fall into nine combinations, A to I (Waples et al. 2019; rows are the first sample, columns the second):
| 0 | 1 | 2 | |
| 0 | A | D | G |
| 1 | B | E | H |
| 2 | C | F | I |
From their counts over the loci the two samples share, the function reports KING-robust kinship, (E - 2(C + G)) / (B + D + H + F + 2E) (Manichaikul et al. 2010); R0 = (C + G) / E and R1 = E / (B + C + D + F + G + H) (Waples et al. 2019); and the heterozygote share, E / min(B + E + H, D + E + F): among the loci where the sample with fewer heterozygous calls is heterozygous, the share where the other is heterozygous too. None of them needs allele frequencies.
With called genotypes the counts are tallied directly. With genotype
likelihoods or read counts they are the expected counts of the
two-dimensional site frequency spectrum of the pair, estimated by EM from
the likelihoods as in NgsRelate (Hanghøj et al. 2019), so that a
heterozygote missed at low depth counts as uncertain rather than as a
homozygote. Likelihoods are 10^(-PL/10); from read counts R (REF) and A
(ALT) they are (1 - e)^R e^A, 0.5^(R + A) and e^R (1 - e)^A for 0/0, 0/1
and 1/1, with e = error_rate. The EM runs in C++ (Rcpp and
RcppParallel), compiled the first time the function is called in a
session, which takes a little while.
Only loci with a minor allele frequency of at least maf are used:
from genotype likelihoods the frequency is estimated by EM, as in
NgsRelate; otherwise it is taken from the called genotypes. Pairs that
share fewer than loc_threshold of these loci get NA and are never
flagged.
Duplicates
A pair is flagged as a duplicate when its KING-robust kinship exceeds
king_threshold. From called genotypes it is also flagged when its
heterozygote share exceeds het_threshold. The heterozygote share
guards against heterozygote dropout, which turns heterozygotes into
homozygotes and rarely the reverse: conditioning on the heterozygous calls
of the poorer sample cancels its dropout. In an outbred population it is
expected to be about 1 for duplicates, 0.5 for parent and offspring, at
most 0.625 for full siblings and 2pq for unrelated pairs; inbreeding and
population structure can raise these values. From called genotypes, KING-robust kinship
underestimates duplicates in which a sample has heterozygote dropout; the
heterozygote share corrects for dropout in the poorer sample of a pair,
but not when both samples are poor, so use genotype likelihoods where
possible. With genotype likelihoods or read counts the heterozygote share
is reported but does not flag pairs, as the EM already accounts for
missed heterozygotes. In a ddRAD study of collared peccaries (102
duplicate pairs by KING from likelihoods), the heterozygote share raised
the duplicates found from called genotypes from 88 to 94, added none from
likelihoods, and from read counts added a pair of relatives at 0.802.
Run gl.report.contamination (and remove contaminated
samples with gl.filter.contamination) before this
function. The rule below keeps the sample with the fewest missing
genotypes, which favours a contaminated sample, as mixed DNA gives more
calls: in the peccary study the pair CP47-CP57 keeps CP57, a mixture of
about 4/5 CP47 and 1/5 CP46.
Flagged pairs are linked into groups (connected components). In each
group the sample with the lowest proportion of missing genotypes is kept
(ties keep the name that sorts first) and the others are suggested for
removal. A group can also link two different animals through a sample
that is a mixture of them (contamination, see
gl.report.contamination); the function warns and lists the
pairs in a group that are not flagged themselves, which should be checked
before samples are removed.
Kinship classes
Each pair gets a class from the KING bins of Manichaikul et al. (2010): first degree above 0.177, second degree above 0.0884, third degree above 0.0442 and unrelated otherwise; flagged pairs are "duplicate", including those flagged only by the heterozygote share. KING-robust kinship assumes a single population: between divergent lineages it is strongly negative (values down to -3 are expected), which still means unrelated.
Plot
The top panel plots every pair by KING-robust kinship and heterozygote
share, with dashed lines at king_threshold, at 0.177 and, when it
is used, at het_threshold; flagged pairs are labelled when there are 30 or
fewer and package ggrepel is installed. The kinship axis is cut at -1,
and a caption gives the number of pairs below it. Duplicates sit to the
right (from likelihoods) or at the top (from calls with dropout). The
bottom panel is a histogram of the statistic that separates duplicates:
the kinship of the pairs above 0, with the bounds of the classes, or,
from called genotypes, the heterozygote share of the pairs above 0.4,
with lines at 0.5 (parent and offspring), 0.625 (the largest expected
for full siblings in an outbred population) and het_threshold. A gap between the relatives
and the duplicates means the duplicate calls are clear-cut.
A file-backed (FBM) object (called genotypes) is read from its backing file in blocks of loci: missing data, allele frequencies and the counts of the nine genotype combinations are added block by block, so the genotype matrix is never decoded as a whole, and the results are identical to those of the same data held in memory.
Value
A list, returned invisibly, with:
table.rep: the flagged pairs, with their statistics, class, group, the proportion of missing genotypes of each sample (ind1_miss, ind2_miss) and ind_to_drop, the sample of the pair with more missing genotypes (ties: the name that sorts last). In a group where every pair is flagged, ind_to_drop lists exactly ind.list.drop.
ind.list.drop: the samples suggested for removal.
ind.list.rep: for each sample in a flagged pair, its duplicates.
table.all: every pair (ind1 before ind2 in the object), with nloc (shared loci), KING, R0, R1, het_share, class and flagged.
ind.miss: the proportion of missing genotypes of each sample.
input: the data used, "likelihoods", "counts" or "calls".
parameters: the thresholds; het_threshold_used, TRUE when
het_thresholdflagged pairs (called genotypes only); and n.sites, the number of loci that passedmaf.plot: the plot (a patchwork of two ggplots), or NULL when
plot.out = FALSE.
Author(s)
Author(s): Luis Mijangos. Custodian: Luis Mijangos – Post to https://groups.google.com/d/forum/dartr
References
Hanghøj K, Moltke I, Andersen PA, Manica A, Korneliussen TS (2019) Fast and accurate relatedness estimation from high-throughput sequencing data in the presence of inbreeding. GigaScience 8: giz034.
Manichaikul A, Mychaleckyj JC, Rich SS, Daly K, Sale M, Chen WM (2010) Robust relationship inference in genome-wide association studies. Bioinformatics 26: 2867-2873.
Waples RK, Albrechtsen A, Moltke I (2019) Allele frequency-free inference of close familial relationships from genotypes or low-depth sequencing data. Molecular Ecology 28: 35-48.
See Also
gl.filter.replicates.KING,
gl.report.replicates, gl.read.vcf
Other matched report:
gl.report.allna(),
gl.report.callrate(),
gl.report.contamination(),
gl.report.excess.het(),
gl.report.factorloadings(),
gl.report.fstat(),
gl.report.hamming(),
gl.report.heterozygosity(),
gl.report.hwe(),
gl.report.ld(),
gl.report.ld.map(),
gl.report.locmetric(),
gl.report.maf(),
gl.report.overshoot(),
gl.report.pa(),
gl.report.rdepth(),
gl.report.replicates(),
gl.report.reproducibility(),
gl.report.secondaries(),
gl.report.taglength()
Examples
if (isTRUE(getOption("dartR_fbm"))) platypus.gl <- gl.gen2fbm(platypus.gl)
res <- gl.report.replicates.KING(platypus.gl)
head(res$table.all)
Reports summary of RepAvg (repeatability averaged over both alleles for each locus) or reproducibility (repeatability of the scores for fragment presence/absence)
Description
SNP datasets generated by DArT have an index, RepAvg, generated by reproducing the data independently for 30 of alleles that give a repeatable result, averaged over both alleles for each locus. In the case of fragment presence/absence data (SilicoDArT), repeatability is the percentage of scores that are repeated in the technical replicate dataset.
Usage
gl.report.reproducibility(
  x,
  plot.display = TRUE,
  plot.theme = theme_dartR(),
  plot.colors = NULL,
  plot.dir = NULL,
  plot.file = NULL,
  verbose = NULL
)
Arguments
x |
Name of the genlight object containing the SNP or presence/absence (SilicoDArT) data [required]. |
plot.display |
Specify if plot is to be produced [default TRUE]. |
plot.theme |
Theme for the plot. See Details for options [default theme_dartR()]. |
plot.colors |
Vector with two color names for the borders and fill [default c("#2171B5", "#6BAED6")]. |
plot.dir |
Directory to save the plot RDS files [default as specified by the global working directory or tempdir()] |
plot.file |
Filename (minus extension) for the RDS plot file [Required for plot save] |
verbose |
Verbosity: 0, silent or fatal errors; 1, begin and end; 2, progress log; 3, progress and results summary; 5, full report [default NULL, adopting the global verbosity set by gl.set.verbosity(), or 2 if no global is set]. |
Details
The function displays a table of minimum, maximum, mean and quantiles for
repeatability against possible thresholds that might subsequently be
specified in gl.filter.reproducibility.
If plot.display=TRUE, display also includes a boxplot and a histogram to guide
in the selection of a threshold for filtering on repeatability.
If plot.file is specified, plots are saved to the directory specified by the user, or the global
default working directory set by gl.set.wd() or to the tempdir().
For examples of themes, see:
Value
An unaltered genlight object
Author(s)
Custodian: Arthur Georges. Author(s): Arthur Georges – Post to https://groups.google.com/d/forum/dartr
See Also
Other matched report:
gl.report.allna(),
gl.report.callrate(),
gl.report.contamination(),
gl.report.excess.het(),
gl.report.factorloadings(),
gl.report.fstat(),
gl.report.hamming(),
gl.report.heterozygosity(),
gl.report.hwe(),
gl.report.ld(),
gl.report.ld.map(),
gl.report.locmetric(),
gl.report.maf(),
gl.report.overshoot(),
gl.report.pa(),
gl.report.rdepth(),
gl.report.replicates(),
gl.report.replicates.KING(),
gl.report.secondaries(),
gl.report.taglength()
Examples
# SNP data
if (isTRUE(getOption("dartR_fbm"))) testset.gl <- gl.gen2fbm(testset.gl)
  out <- gl.report.reproducibility(testset.gl)
# Tag P/A data
  out <- gl.report.reproducibility(testset.gs)
Reports loci containing secondary SNPs in sequence tags and calculates number of invariant sites
Description
SNP datasets generated by DArT include fragments with more than one SNP (that is, with secondaries). They are recorded separately with the same CloneID (=AlleleID). These multiple SNP loci within a fragment are likely to be linked, and so you may wish to remove secondaries. This function reports statistics associated with secondaries, and the consequences of filtering them out, and provides three plots. The first is a boxplot, the second is a barplot of the frequency of secondaries per sequence tag, and the third is the Poisson expectation for those frequencies including an estimate of the zero class (no. of sequence tags with no SNP scored).
Usage
gl.report.secondaries(
  x,
  nsim = 1000,
  taglength = 69,
  plot.display = TRUE,
  plot.theme = theme_dartR(),
  plot.colors = NULL,
  plot.dir = NULL,
  plot.file = NULL,
  verbose = NULL
)
Arguments
x |
Name of the genlight object [required]. |
nsim |
Maximum number of iterations for the fixed-point estimation of the mean (lambda) of the Poisson distribution [default 1000]. |
taglength |
Typical length of the sequence tags [default 69]. |
plot.display |
Specify if plot is to be produced [default TRUE]. |
plot.theme |
Theme for the plot. See Details for options [default theme_dartR()]. |
plot.colors |
Vector with two color names for the borders and fill [default c("#2171B5", "#6BAED6")]. |
plot.dir |
Directory to save the plot RDS files [default as specified by the global working directory or tempdir()] |
plot.file |
Filename (minus extension) for the RDS plot file [Required for plot save] |
verbose |
Verbosity: 0, silent or fatal errors; 1, begin and end; 2, progress log; 3, progress and results summary; 5, full report [default NULL, adopting the global verbosity set by gl.set.verbosity(), or 2 if no global is set]. |
Details
The function gl.filter.secondaries will filter out the
loci with secondaries retaining only one sequence tag.
Heterozygosity as estimated by the function
gl.report.heterozygosity is in a sense relative, because it
is calculated against a background of only those loci that are polymorphic
somewhere in the dataset. To allow intercompatibility across studies and
species, any measure of heterozygosity needs to accommodate loci that are
invariant (autosomal heterozygosity. See Schmidt et al 2021). However, the
number of invariant loci are unknown given the SNPs are detected as single
point mutational variants and invariant sequences are discarded, and
because of the particular additional filtering pre-analysis. Modelling the
counts of SNPs per sequence tag as a Poisson distribution in this script
allows estimate of the zero class, that is, the number of invariant loci.
This is reported, and the veracity of the estimate can be assessed by the
correspondence of the observed frequencies against those under Poisson
expectation in the associated graphs. The number of invariant loci can then
be optionally provided to the function
gl.report.heterozygosity via the parameter n.invariants.
In case the calculations for the Poisson expectation of the number of
invariant sequence tags fail to converge, try to rerun the analysis with a
larger nsim values.
This function now also calculates the number of invariant sites (i.e.
nucleotides) of the sequence tags (if TrimmedSequence is present in
x$other$loc.metrics) or estimate these by assuming that the average
length of the sequence tags is 69 nucleotides. Based on the Poisson
expectation of the number of invariant sequence tags, it also estimates the
number of invariant sites for these to eventually provide an estimate of
the total number of invariant sites.
Note, previous version of
dartR would only return an estimate of the number of invariant
sequence tags (not sites).
If plot.file is specified, plots are saved to the directory specified by the user, or the global
default working directory set by gl.set.wd() or to the tempdir().
Examples of other themes that can be used can be consulted in:
Value
A data.frame with the list of parameter values:
n.total.tags Number of sequence tags in total
n.SNPs.secondaries Number of secondary SNP loci that would be removed on filtering
n.invariant.tags Estimated number of invariant sequence tags
n.tags.secondaries Number of sequence tags with secondaries
n.inv.gen Number of invariant sites in sequenced tags
mean.len.tag Mean length of sequence tags
n.invariant Total Number of invariant sites (including invariant sequence tags)
Lambda Mean of the Poisson distribution of number of SNPs in the sequence tags
Author(s)
Author(s): Arthur Georges. Custodian: Arthur Georges – Post to https://groups.google.com/d/forum/dartr
References
Schmidt, T.L., Jasper, M.-E., Weeks, A.R., Hoffmann, A.A., 2021. Unbiased population heterozygosity estimates from genome-wide sequence data. Methods in Ecology and Evolution n/a.
See Also
gl.filter.secondaries,gl.report.heterozygosity,
utils.n.var.invariant
Other matched report:
gl.report.allna(),
gl.report.callrate(),
gl.report.contamination(),
gl.report.excess.het(),
gl.report.factorloadings(),
gl.report.fstat(),
gl.report.hamming(),
gl.report.heterozygosity(),
gl.report.hwe(),
gl.report.ld(),
gl.report.ld.map(),
gl.report.locmetric(),
gl.report.maf(),
gl.report.overshoot(),
gl.report.pa(),
gl.report.rdepth(),
gl.report.replicates(),
gl.report.replicates.KING(),
gl.report.reproducibility(),
gl.report.taglength()
Examples
require("dartR.data")
if (isTRUE(getOption("dartR_fbm"))) platypus.gl <- gl.gen2fbm(platypus.gl)
test <- gl.filter.callrate(platypus.gl,threshold = 1)
n.inv <- gl.report.secondaries(test)
gl.report.heterozygosity(test, n.invariant = n.inv[7, 2])
Reports Shannon-based diversity profiles (Hill numbers) for individuals and populations
Description
Calculates diversity of order q (Hill numbers) from SNP dosages, following Ma, Li & Zhang (2020). With level = 'alpha' (the default) the function reports a diversity profile for each individual; with level = 'beta' or 'gamma' it partitions diversity among the individuals within each population and reports one profile per population.
Usage
gl.report.shannon(
  x,
  plot.display = TRUE,
  plot.theme = theme_dartR(),
  plot.colors = gl.colors("dis", verbose = 0),
  plot.dir = NULL,
  plot.file = NULL,
  level = "alpha",
  order = 5,
  verbose = NULL
)
Arguments
x |
Name of the genlight object containing the SNP data [required]. |
plot.display |
If TRUE, resultant plots are displayed in the plot window [default TRUE]. |
plot.theme |
Theme for the plot. See Details for options [default theme_dartR()]. |
plot.colors |
Colours for the bars of each diversity order: either a palette function that takes the number of colours, or a vector with one colour per order (order colours, for q = 0 to order - 1) [default gl.colors("dis", verbose = 0)]. |
plot.dir |
Directory to save the plot RDS files [default as specified by the global working directory or tempdir()]. |
plot.file |
Name for the RDS binary file to save (base name only, exclude extension) [default NULL]. |
level |
The level of diversity to report: 'alpha' for a profile per individual; 'beta' or 'gamma' for the partition of diversity among individuals within each population [default 'alpha']. |
order |
The number of diversity orders to report, spanning q = 0 to order - 1 [default 5]. |
verbose |
Verbosity: 0, silent or fatal errors; 1, begin and end; 2, progress log; 3, progress and results summary; 5, full report [default NULL, adopting the global verbosity set by gl.set.verbosity(), or 2 if no global is set]. |
Details
Genotypes are taken as dosages of the alternate allele (0, 1 or 2), and the dosages act as abundances. For each individual, missing genotypes and zero dosages are dropped, the remaining dosages are normalised to proportions p, and the diversity of order q is computed as
q = 0: the number of loci with non-zero dosage (richness);
q = 1: exp(-sum(p log p)), the exponential of Shannon entropy (natural logarithms; Hill numbers are free of the logarithm base);
q >= 2: (sum(p^q))^(1/(1-q)) (q = 2 is the inverse Simpson index).
The profile spans orders q = 0 to order - 1. For level = 'beta' or 'gamma', the individuals of each population form an abundance matrix (individuals x loci, missing genotypes as zero) and the matrix forms of Ma, Li & Zhang (2020) apply per population: gamma is the diversity of the pooled locus abundances, alpha is the mean within-individual diversity (normalised over the population total), and beta = gamma / alpha is the effective number of distinct individuals in the population (ranging from 1, all individuals identical in profile, to the number of individuals). The multiplicative partition gamma = alpha x beta holds at every order. If the object has no population assignments, all individuals are assigned to a single population 'pop1' with a warning. Individuals with no non-missing, non-zero dosages (all genotypes missing or all homozygous for the reference allele) carry no abundance information: their rows are reported as NA at level = 'alpha', they are excluded from the population matrices at level = 'beta' and 'gamma', and a warning names them. If a plot.file is given, the ggplot arising from this function is saved as an "RDS" binary file using saveRDS(); can be reloaded with readRDS(). A file name must be specified for the plot to be saved. If a plot directory (plot.dir) is specified, the ggplot binary is saved to that directory; otherwise to the tempdir().
Value
A dataframe, returned invisibly: for level = 'alpha', one row per individual (ID, q0 ... q(order-1)); for level = 'beta' or 'gamma', one row per population (pop, q0 ... q(order-1)).
Author(s)
Author(s): Ching Ching Lau. Custodian: Ching Ching Lau – Post to https://groups.google.com/d/forum/dartr
References
Ma, Z., Li, L., & Zhang, Y. P. (2020). Defining individual-level genetic diversity and similarity profiles. Scientific reports, 10(1), 5805.
See Also
Other unmatched report:
gl.allele.freq(),
gl.report.allelerich(),
gl.report.basics(),
gl.report.diversity(),
gl.report.polyploid_heterozygosity()
Examples
require("dartR.data")
div <- gl.report.shannon(possums.gl[1:30, ])
div.beta <- gl.report.shannon(possums.gl[1:30, ], level = "beta", order = 3)
Reports summary of sequence tag length across loci
Description
SNP datasets generated by DArT typically have sequence tag lengths ranging from 20 to 69 base pairs. This function reports summary statistics of the tag lengths.
Usage
gl.report.taglength(
  x,
  plot.display = TRUE,
  plot.theme = theme_dartR(),
  plot.colors = NULL,
  plot.file = NULL,
  plot.dir = NULL,
  verbose = NULL
)
Arguments
x |
Name of the genlight object containing the SNP [required]. |
plot.display |
If TRUE, histograms of tag length are displayed in the plot window [default TRUE]. |
plot.theme |
Theme for the plot. See Details for options [default theme_dartR()]. |
plot.colors |
List of two color names for the borders and fill of the plots [default c("#2171B5", "#6BAED6")]. |
plot.file |
Name for the RDS binary file to save (base name only, exclude extension) [default NULL] |
plot.dir |
Directory in which to save files [default = working directory] |
verbose |
Verbosity: 0, silent or fatal errors; 1, begin and end; 2, progress log; 3, progress and results summary; 5, full report [default NULL, adopting the global verbosity set by gl.set.verbosity(), or 2 if no global is set]. |
Details
This function reports sequence tag lengths for a genlight object. It is a companion
function to gl.filter.taglength which can be used to filter out
loci with a tag length less than a specified threshold.
The table of quantiles is useful for deciding a threshold for subsequent filtering
as it provides an indication of the percentages of loci that will be retained and
lost.
Function's output
The minimum, maximum, mean and a tabulation of tag length quantiles against
thresholds are output to the console. The output also includes a boxplot and a
histogram to guide in the selection of a threshold for filtering on tag
length.
If a plot.file is given, the ggplot arising from this function is saved as an "RDS" binary file using saveRDS(); can be reloaded with readRDS(). A file name must be specified for the plot to be saved. If a plot directory (plot.dir) is specified, the ggplot binary is saved to that directory; otherwise to the tempdir().
Examples of other themes that can be used can be consulted in
To avoid issues from inadvertent use of this function in an assignment statement, the function returns the genlight object unaltered.
Value
Returns unaltered genlight object
Author(s)
Author(s): Arthur Georges. Custodian: Arthur Georges – Post to https://groups.google.com/d/forum/dartr
See Also
Other matched report:
gl.report.allna(),
gl.report.callrate(),
gl.report.contamination(),
gl.report.excess.het(),
gl.report.factorloadings(),
gl.report.fstat(),
gl.report.hamming(),
gl.report.heterozygosity(),
gl.report.hwe(),
gl.report.ld(),
gl.report.ld.map(),
gl.report.locmetric(),
gl.report.maf(),
gl.report.overshoot(),
gl.report.pa(),
gl.report.rdepth(),
gl.report.replicates(),
gl.report.replicates.KING(),
gl.report.reproducibility(),
gl.report.secondaries()
Examples
if (isTRUE(getOption("dartR_fbm"))) testset.gl <- gl.gen2fbm(testset.gl)
out <- gl.report.taglength(testset.gl)
Samples individuals from populations
Description
Draws a subsample of individuals from a genlight object, with or without replacement, either from each population separately or from the object as a whole.
Usage
gl.sample(x, nsample = NULL, replace = TRUE, onepop = FALSE, verbose = NULL)
Arguments
x |
Name of the genlight object containing the SNP or presence/absence (SilicoDArT) data [required]. |
nsample |
Number of individuals to draw, per population when onepop = FALSE and in total when onepop = TRUE. Must be a positive whole number [default NULL, the size of the smallest population when onepop = FALSE, nInd(x) when onepop = TRUE]. |
replace |
If TRUE, sampling is with replacement [default TRUE]. |
onepop |
If TRUE, ignore the population assignments of the genlight object and draw from all individuals as a single pool [default FALSE]. |
verbose |
Verbosity: 0, silent or fatal errors; 1, begin and end; 2, progress log; 3, progress and results summary; 5, full report [default NULL, adopting the global verbosity set by gl.set.verbosity(), or 2 if no global is set]. |
Details
This function supports a bootstrap approach in dartR. For a bootstrap it is often desirable to draw a defined number of individuals from each of the populations in a genlight object, calculate a quantity for that subset, and repeat the draw many times.
Parameter nsample has two meanings, set by onepop:
onepop = FALSE: nsample is a per-population count. The result holds nsample individuals from every population, including a population with only one member, so nInd is nsample times the number of populations.
onepop = TRUE: population structure is ignored and nsample is a whole-object total. The result holds nsample individuals drawn from all individuals, each carrying its original population label.
The default nsample follows the same split: the size of the smallest population when onepop = FALSE, and nInd(x) when onepop = TRUE. Population factor levels with no members are ignored.
An individual drawn more than once under replace = TRUE would give the result duplicate individual names, and duplicate names corrupt any downstream join on individual identity. Every returned individual is therefore renamed with a zero-padded ordinal prefix recording its position in the sample, for example 01_AA013220, which makes the names unique by construction. The same names are written to @other$ind.metrics$id so that the two agree.
Resampling individuals invalidates every locus metric computed across individuals, so all entries of @other$loc.metrics.flags are set to FALSE. The stored locus metrics themselves are left as they are, which keeps the cost of a bootstrap replicate down; downstream report and filter functions recalculate what they need because the flags tell them the stored values are stale. Call gl.recalc.metrics() to refresh the metrics in place.
Value
A genlight object holding the drawn individuals, in draw order. Individual-indexed metadata in @other (ind.metrics, latlon and the like) is subset to the drawn individuals, repeating rows for individuals drawn more than once; @other$loc.metrics is carried over unchanged because the loci are unchanged; all entries of @other$loc.metrics.flags are set to FALSE; and the call is appended to @other$history. Individuals are renamed with a zero-padded ordinal prefix (see Details).
Author(s)
Author(s): Bernd Gruber. Custodian: Bernd Gruber – Post to https://groups.google.com/d/forum/dartr
See Also
Other data manipulation:
gl.add.indmetrics(),
gl.define.pop(),
gl.drop.ind(),
gl.drop.loc(),
gl.drop.pop(),
gl.edit.recode.pop(),
gl.fbm.cleanup(),
gl.fbm2gen(),
gl.gen2fbm(),
gl.impute(),
gl.join(),
gl.keep.ind(),
gl.keep.loc(),
gl.keep.pop(),
gl.make.recode.ind(),
gl.make.recode.pop(),
gl.merge.pop(),
gl.reassign.ind(),
gl.reassign.pop(),
gl.recode.ind(),
gl.recode.pop(),
gl.rename.pop(),
gl.sim.genotypes(),
gl.sort(),
gl.subsample.ind(),
gl.subsample.loc(),
gl.subsample.loci()
Examples
# bootstrap for 2 possums populations to check effect of sample size on
# fixed alleles
gl.set.verbosity(0)
if (isTRUE(getOption("dartR_fbm"))) possums.gl <- gl.gen2fbm(possums.gl)
pp <- possums.gl[c(1:30,91:120),]
nrep <- 1:10
nss <- seq(1,10,2)
res <- expand.grid(nrep=nrep, nss=nss)
for (i in 1:nrow(res)) {
dummy <- gl.sample(pp, nsample=res$nss[i], replace=TRUE)
pas <- gl.report.pa(dummy, plot.display= FALSE)
res$fixed[i] <- pas$fixed[1]
}
boxplot(fixed ~ nss, data=res)
Saves an object in compressed binary format for later rapid retrieval
Description
This is a wrapper for saveRDS(). The script saves the object in compressed binary form to the nominated file and returns the input gl object unchanged.
Only the object is saved, not the workspace. A file-backed (FBM) object is saved as a gen-backed copy (genotypes in @gen): an FBM holds only a reference to its backing file, which is usually temporary, and the gen-backed copy is also smaller. The input object stays file-backed. Use gl.load(file, fbm = TRUE) to load it back as a file-backed object.
**Always use gl.save(), not saveRDS(), for a file-backed object.** saveRDS() stores only the reference to the backing file, not the genotypes; the backing file is usually a temporary file that is deleted at the end of the R session, so the genotypes are lost. After saving, check that the file size makes sense for the number of individuals and loci: a file of only a few Kb for thousands of loci means the genotypes were not saved. gl.save() reports the size of the saved file at verbose >= 2.
Usage
gl.save(x, file, verbose = NULL)
Arguments
x |
Name of the genlight object containing SNP genotypes [required]. |
file |
Name of the file to receive the binary version of the object [required]. |
verbose |
Verbosity: 0, silent or fatal errors; 1, begin and end; 2, progress log; 3, progress and results summary; 5, full report [default 2 or as specified using gl.set.verbosity]. |
Value
The input object, returned invisibly
Author(s)
Author(s): Arthur Georges. Custodian: Arthur Georges – Post to https://groups.google.com/d/forum/dartr
See Also
Other io:
gl.load(),
gl.read.PLINK(),
gl.read.csv(),
gl.read.dart(),
gl.read.fasta(),
gl.read.silicodart(),
gl.write.csv(),
utils.read.dart()
Examples
gl.save(testset.gl,file.path(tempdir(),'testset.rds'))
Selects colors from one of several palettes and outputs as a vector
Description
This function draws upon a number of specified color libraries to extract a vector of colors for plotting. For use where the function that follows has a color parameter expecting a vector of colors.
Usage
gl.select.colors(
  x = NULL,
  library = NULL,
  palette = NULL,
  ncolors = NULL,
  select = NULL,
  plot.display = TRUE,
  verbose = NULL
)
Arguments
x |
Optionally, provide a gl object from which to determine the number of populations [default NULL]. |
library |
Name of the color library to be used, one of 'brewer' 'gr.palette', 'gr.hcl' or 'baseR' [default scales::hue_pal]. |
palette |
Name of the color palette to be pulled from the specified library, refer function help [default is library specific]. |
ncolors |
number of colors to be displayed and returned [default 9 or nPop(gl)]. |
select |
select by number the colors to retain in the output vector; can repeat colors. [default NULL]. |
plot.display |
if TRUE, plot the colours in the plot window [default=TRUE] |
verbose |
Verbosity: 0, silent or fatal errors; 1, begin and end; 2, progress log; 3, progress and results summary; 5, full report [default NULL, adopting the global verbosity set by gl.set.verbosity(), or 2 if no global is set]. |
Details
Colors are chosen by specifying a library (one of 'brewer' 'gr.palette', 'gr.hcl' or 'baseR') and a palette within that library. Each library has its own array of palettes, which can be listed as outlined below. Alternatively, if you specify an incorrect palette, the list of available palettes for the specified library will be listed.
The available color libraries and their palettes include:
library 'brewer' and the palettes available can be listed by RColorBrewer::display.brewer.all() and RColorBrewer::brewer.pal.info.
library 'gr.palette' and the palettes available can be listed by grDevices::palette.pals()
library 'gr.hcl' and the palettes available can be listed by grDevices::hcl.pals()
library 'baseR' and the palettes available are: 'rainbow','heat', 'topo.colors','terrain.colors','cm.colors'.
If the library is not specified, then the default library 'scales' is set and the default palette of 'hue_pal is set.
If the library is set but the palette is not specified, all palettes for that library will be listed and a default palette will then be chosen. The color palette will be displayed in the graphics window for the requested number of colors (or 9 if not specified or nPop(gl) if a genlight object is specified),and the vector of colors returned by assignment for later use. The select parameter can be used to select colors from the specified ncolors. For example, select=c(1,1,3) will select color 1, 1 again and 3 to retain in the final vector. This can be useful for fine-tuning color selection, and matching colors and shapes.
Value
A vector with the required number of colors
Author(s)
Author(s): Arthur Georges. Custodian: Arthur Georges – Post to https://groups.google.com/d/forum/dartr
See Also
Other graphics:
gl.colors(),
gl.map.interactive(),
gl.plot.heatmap(),
gl.plot.snp.density(),
gl.select.shapes(),
gl.smearplot(),
gl.tree.nj()
Examples
# SET UP DATASET
if (isTRUE(getOption("dartR_fbm"))) testset.gl <- gl.gen2fbm(testset.gl)
gl <- testset.gl
levels(pop(gl))<-c(rep('Coast',5),rep('Cooper',3),rep('Coast',5),
rep('MDB',8),rep('Coast',7),'Em.subglobosa','Em.victoriae')
# EXAMPLES -- SIMPLE
colors <- gl.select.colors()
colors <- gl.select.colors(library='brewer',palette='Spectral',ncolors=6)
colors <- gl.select.colors(library='baseR',palette='terrain.colors',ncolors=6)
colors <- gl.select.colors(library='baseR',palette='rainbow',ncolors=12)
colors <- gl.select.colors(library='gr.hcl',palette='RdBu',ncolors=12)
colors <- gl.select.colors(library='gr.palette',palette='Pastel 1',ncolors=6)
# EXAMPLES -- SELECTING colorS
colors <- gl.select.colors(library='baseR',palette='rainbow',ncolors=12,select=c(1,1,1,5,8))
# EXAMPLES -- CROSS-CHECKING WITH A GENLIGHT OBJECT
colors <- gl.select.colors(x=gl,library='baseR',palette='rainbow',ncolors=12,select=c(1,1,1,5,8))
Selects shapes from the base R shape palette and outputs as a vector
Description
This script draws upon the standard R shape palette to extract a vector of shapes for plotting, where the script that follows has a shape parameter expecting a vector of shapes.
Usage
gl.select.shapes(x = NULL, select = NULL, plot.display = TRUE, verbose = NULL)
Arguments
x |
Optionally, provide a gl object from which to determine the number of populations [default NULL]. |
select |
Select the shapes to retain in the output vector [default NULL, all shapes shown and returned]. |
plot.display |
If TRUE, the shape palette is displayed in the graphics window [default TRUE; display is suppressed when verbose is 0]. |
verbose |
Verbosity: 0, silent or fatal errors; 1, begin and end; 2, progress log; 3, progress and results summary; 5, full report [default 2 or as specified using gl.set.verbosity]. |
Details
By default the shape palette will be displayed in full in the graphics window from which shapes can be selected in a subsequent run, and the vector of shapes returned for later use. The select parameter can be used to select shapes from the specified 26 shapes available (0-25). For example, select=c(1,1,3) will select shape 1, 1 again and 3 to retain in the final vector. This can be useful for fine-tuning shape selection, and matching colors and shapes. If a gl object is provided, the number of specified shapes must agree with the number of populations; if select is not specified, one shape is assigned per population. The palette is displayed only when plot.display=TRUE (the default) and verbose >= 1.
Value
A vector with the required number of shapes
Author(s)
Author(s): Arthur Georges. Custodian: Arthur Georges – Post to https://groups.google.com/d/forum/dartr
See Also
Other graphics:
gl.colors(),
gl.map.interactive(),
gl.plot.heatmap(),
gl.plot.snp.density(),
gl.select.colors(),
gl.smearplot(),
gl.tree.nj()
Examples
# SET UP DATASET
if (isTRUE(getOption("dartR_fbm"))) testset.gl <- gl.gen2fbm(testset.gl)
gl <- testset.gl
levels(pop(gl))<-c(rep('Coast',5),rep('Cooper',3),rep('Coast',5),
rep('MDB',8),rep('Coast',7),'Em.subglobosa','Em.victoriae')
# EXAMPLES
shapes <- gl.select.shapes() # Select and display available shapes
# Select and display a restricted set of shapes
shapes <- gl.select.shapes(select=c(1,1,1,5,8))
 # Select set of shapes and check with no. of pops.
shapes <- gl.select.shapes(x=gl,select=c(1,1,1,5,8))
Sets the default verbosity level
Description
dartR functions have a verbosity parameter that sets the level of reporting during the execution of the function. The verbosity level, set by parameter 'verbose' can be one of verbose 0, silent or fatal errors; 1, begin and end; 2, progress log; 3, progress and results summary; 5, full report. The default value for verbosity is stored in the r environment. This script sets the default value.
Usage
gl.set.verbosity(value = 2)
Arguments
value |
Set the default verbosity to be this value: 0, silent only fatal errors; 1, begin and end; 2, progress log; 3, progress and results summary; 5, full report. An invalid value is coerced to 2 with a warning [default 2]. |
Value
The verbosity value actually set, returned invisibly.
Author(s)
Author(s): Arthur Georges. Custodian: Arthur Georges (Post to https://groups.google.com/d/forum/dartr)
See Also
Other environment:
gl.check.verbosity(),
gl.check.wd(),
gl.print.history(),
gl.recalc.metrics(),
gl.set.wd(),
theme_dartR()
Examples
gl.set.verbosity(value = 2)
Sets the default working directory
Description
Many dartR functions have a plot.dir parameter which is used to save output to (e.g. ggplots as rds files). With this function users can set the working directory globally so it is used in all functions, without setting it explicitly. The value for wd is stored in the r environment and if not set defaults to tempdir(). This function sets the default value.
Usage
gl.set.wd(wd = tempdir(), verbose = NULL)
Arguments
wd |
Path to the directory to set globally as the working directory, to be used by all functions when not set explicitly in the function [default tempdir()]. |
verbose |
Verbosity: 0, silent or fatal errors; 1, begin and end; 2, progress log; 3, progress and results summary; 5, full report [default NULL, adopting the global verbosity set by gl.set.verbosity(), or 2 if no global is set]. |
Details
The nominated directory must already exist; gl.set.wd() does not create it. If the path does not exist (or is not a single directory path) the function stops with an error and the global working directory is left unchanged.
Value
path to the working directory [set for all functions]
Author(s)
Author(s): Bernd Gruber. Custodian: Bernd Gruber (Post to https://groups.google.com/d/forum/dartr)
See Also
Other environment:
gl.check.verbosity(),
gl.check.wd(),
gl.print.history(),
gl.recalc.metrics(),
gl.set.verbosity(),
theme_dartR()
Examples
#set to current working directory
wd <- gl.set.wd(wd=getwd())
Generates crosses between fathers and mothers
Description
Crosses a cohort of fathers (in one genlight object) with a cohort of mothers (in a second genlight object), generating a brood of a specified size for each pair, then retains a random subset of the offspring.
Usage
gl.sim.crosses(
  fathers,
  mothers,
  broodsize = 10,
  sexratio = 0.5,
  n = NULL,
  error.check = TRUE,
  compliance.check = TRUE,
  verbose = NULL
)
Arguments
fathers |
Genlight object of potential fathers [required]. |
mothers |
Genlight object of potential mothers [required]. |
broodsize |
Number of offspring per mother. Must be a positive integer; any other value is replaced by 10 with a warning [default 10]. |
sexratio |
Expected proportion of female offspring. Must be in the range 0 to 1; any other value is replaced by 0.5 with a warning [default 0.5]. |
n |
Number of offspring to retain, drawn at random from the full brood. If n exceeds the number of offspring generated, all of them are retained, with a warning [default NULL, resolving to 1000 or mothers*broodsize, whichever is the lesser]. |
error.check |
If TRUE, also checks that the two parent cohorts are scored on identical loci [default TRUE]. |
compliance.check |
If TRUE, will perform a compliance check on the resultant genlight object before returning it [default TRUE]. |
verbose |
Verbosity: 0, silent or fatal errors; 1, begin and end; 2, progress log; 3, progress and results summary; 5, full report [default NULL, adopting the global verbosity set by gl.set.verbosity(), or 2 if no global is set]. |
Details
Pairing is positional: father i is crossed with mother i, in every brood replicate. The two parent cohorts must therefore hold the same number of individuals, scored on the same loci. Randomising which male breeds with which female is the caller's responsibility, and is done by subsampling the parent cohorts before calling this function. Each parent contributes one gamete per offspring. A homozygous locus transmits its only allele; a heterozygous locus transmits one of its two alleles, drawn independently for every heterozygous call, in every parent, in every brood replicate. A locus scored as missing in either parent yields a missing call in the offspring. This script is to be used in conjunction with gl.subsample.ind() applied initially to a base genlight object containing male and female genotypes. The workflow is: (a) Select the males from the base genlight object using gl.keep.pop() with pop.list set to the label used for males in the sex metadata and the as.pop parameter set to "sex". Note that gl.keep.pop() restores the original population assignments afterwards, and that gl.subsample.ind() subsamples within populations, so assign a single population to the result before subsampling. (b) Select the females in the same way. (c) Subsample a cohort of males and an equally sized cohort of females for breeding using gl.subsample.ind() and the replace parameter as follows. To enforce monogamy – subsample both cohorts with replace=FALSE. To admit polygyny – subsample the fathers with replace=TRUE and the mothers with replace=FALSE, so that a male can appear more than once. To admit polyandry – subsample the fathers with replace=FALSE and the mothers with replace=TRUE. To admit promiscuity – subsample both cohorts with replace=TRUE. These are simple scenarios that leave the number of mates per individual to chance, depending on the random selection of parents with replacement. (d) Cross the two cohorts using gl.sim.crosses(), retaining a subset of the offspring at random.
  males <- gl.keep.pop(testset.gl, pop.list = "Male",
                       as.pop = "sex", verbose = 0)
  females <- gl.keep.pop(testset.gl, pop.list = "Female",
                         as.pop = "sex", verbose = 0)
  pop(males) <- rep("males", nInd(males))
  pop(females) <- rep("females", nInd(females))
  fathers <- gl.subsample.ind(males, n = 10, replace = TRUE, verbose = 0)
  mothers <- gl.subsample.ind(females, n = 10, replace = FALSE, verbose = 0)
  offspring <- gl.sim.crosses(fathers, mothers, broodsize = 5, n = 20)
The offspring object records its parentage in
@other$ind.metrics$mother and @other$ind.metrics$father.
Set error.check to FALSE if using this script in simulations. The structural
checks (parameter ranges, matching cohort sizes and locus counts) always
run; error.check governs only the comparison of the two locus panels for
identity, which scales with the number of loci.
Value
A genlight object with n offspring of both sexes.
Author(s)
Author(s): Bernd Gruber. Custodian: Bernd Gruber – Post to https://groups.google.com/d/forum/dartr
See Also
Examples
males <- gl.keep.pop(testset.gl, pop.list = "Male",
                     as.pop = "sex", verbose = 0)
females <- gl.keep.pop(testset.gl, pop.list = "Female",
                       as.pop = "sex", verbose = 0)
pop(males) <- rep("males", nInd(males))
pop(females) <- rep("females", nInd(females))
fathers <- gl.subsample.ind(males, n = 5, replace = FALSE, verbose = 0)
mothers <- gl.subsample.ind(females, n = 5, replace = FALSE, verbose = 0)
offspring <- gl.sim.crosses(fathers, mothers, broodsize = 4, n = 10,
                            verbose = 0)
nInd(offspring)
head(offspring@other$ind.metrics)
Generate random genotypes
Description
Generates random genotypes for each population of a genlight object by drawing, locus by locus, from the allele frequencies of that population.
Usage
gl.sim.genotypes(x, n.ind = 200, verbose = NULL)
Arguments
x |
Name of the genlight object [required]. |
n.ind |
Number of individuals to be simulated in each population. Must be a single whole number of 1 or more; a non-integer value is rounded with a warning. Capped at the number of loci [default 200]. |
verbose |
Verbosity: 0, silent or fatal errors; 1, begin and end; 2, progress log; 3, progress and results summary; 5, full report [default NULL, adopting the global verbosity set by gl.set.verbosity(), or 2 if no global is set]. |
Details
Allele frequencies are estimated WITHIN each population of x, and each population is then simulated separately. For every locus, two haplotype vectors of length n.ind are drawn independently, each with probability equal to the allele frequency of that population at that locus, and the two are added to give a dosage of 0, 1 or 2. The simulated genotypes are therefore in Hardy-Weinberg equilibrium within each population, and the allele frequency differences among the populations of x – the population structure – are carried through to the simulated object. n.ind is the number of individuals simulated PER POPULATION, so an object with nPop(x) populations returns n.ind * nPop(x) individuals. The simulated individuals are named Ind_1 ... Ind_n and are assigned the population names of the source object. Locus names, and the number of loci, are those of the source object. A locus with no called genotypes in a given population has no estimable allele frequency. Such a locus is returned as missing (NA) for every individual of that population rather than aborting the run, so a locus that is all-missing across the whole source object is all-missing in the simulated object. No other missing data are simulated: every locus with an estimable frequency is called for every individual of that population. If n.ind exceeds the number of loci, n.ind is reduced to the number of loci. Ordinations such as PCA require more attributes (loci) than entities (individuals), and the cap keeps each simulated population inside that bound. The returned object carries the call that made it as its only history entry, so gl.print.history() on a saved simulated dataset reports the simulation rather than the internal housekeeping calls.
Value
A genlight object holding the simulated genotypes, with n.ind individuals in each population of the source object.
Author(s)
Author(s): Arthur Georges. Custodian: Arthur Georges – Post to https://groups.google.com/d/forum/dartr
See Also
gl.sim.crosses, gl.filter.allna
Other data manipulation:
gl.add.indmetrics(),
gl.define.pop(),
gl.drop.ind(),
gl.drop.loc(),
gl.drop.pop(),
gl.edit.recode.pop(),
gl.fbm.cleanup(),
gl.fbm2gen(),
gl.gen2fbm(),
gl.impute(),
gl.join(),
gl.keep.ind(),
gl.keep.loc(),
gl.keep.pop(),
gl.make.recode.ind(),
gl.make.recode.pop(),
gl.merge.pop(),
gl.reassign.ind(),
gl.reassign.pop(),
gl.recode.ind(),
gl.recode.pop(),
gl.rename.pop(),
gl.sample(),
gl.sort(),
gl.subsample.ind(),
gl.subsample.loc(),
gl.subsample.loci()
Examples
# possums.gl has 10 populations, so this returns 10 x 20 = 200 individuals
sim <- gl.sim.genotypes(possums.gl, n.ind = 20, verbose = 0)
nInd(sim)
table(pop(sim))
# Loci with no calls in a population come back missing for that population
sim2 <- gl.sim.genotypes(testset.gl, n.ind = 10, verbose = 0)
nLoc(sim2) == nLoc(testset.gl)
Smear plot
Description
Each locus is color coded for scores of 0, 1, 2 and NA for SNP data and 0, 1 and NA for presence/absence (SilicoDArT) data. Individual labels can be added. The plot may become cluttered if there are too many individuals; if so, it is best to use ind.labels = FALSE.
Works with both SNP data and P/A data (SilicoDArT). Missing data are shown in the NA color (the fourth plot color) and labelled NA in the legend.
Usage
gl.smearplot(
  x,
  plot.display = TRUE,
  ind.labels = FALSE,
  label.size = 10,
  group.pop = FALSE,
  plot.theme = NULL,
  plot.colors = NULL,
  loc.names = FALSE,
  loc.order = FALSE,
  interactive = FALSE,
  den = FALSE,
  plot.file = NULL,
  plot.dir = NULL,
  het.only = FALSE,
  legend = "bottom",
  verbose = NULL
)
Arguments
x |
Name of the genlight object [required]. |
plot.display |
If TRUE, the plot is displayed in the plot window [default TRUE]. |
ind.labels |
If TRUE, individual IDs are shown [default FALSE]. |
label.size |
Size of the individual labels [default 10]. |
group.pop |
If ind.labels is TRUE, group by population [default FALSE]. |
plot.theme |
Theme for the plot. See Details for options [default NULL]. |
plot.colors |
List of four color names for the column fill for homozygous reference, heterozygous, homozygous alternate, and missing value (NA) [default c("#0000FF","#00FFFF","#FF0000","#e0e0e0")]. |
loc.names |
If TRUE, loci names are shown on the horiontal axis [default FALSE]. |
loc.order |
If TRUE, loci are ordered by chromosome and by SNP position [default FALSE]. |
interactive |
If TRUE, an interactive version is generated [default FALSE]. |
den |
If TRUE, a dendrogram is generated and used to order individuals [default FALSE]. |
plot.file |
Name for the RDS binary file to save (base name only, exclude extension) [default NULL]. |
plot.dir |
Directory to save the plot RDS files [default as specified by the global working directory or tempdir()]. |
het.only |
If TRUE, show only the heterozygous state (SNP data only) [default FALSE]. |
legend |
Position of the legend: 'left', 'top', 'right', 'bottom' or 'none' [default 'bottom']. |
verbose |
Verbosity: 0, silent or fatal errors; 1, begin and end; 2, progress log; 3, progress and results summary; 5, full report [default 2 or as specified using gl.set.verbosity]. |
Value
Returns the ggplot object
Author(s)
Author(s): Arthur Georges. Custodian: Arthur Georges – Post to https://groups.google.com/d/forum/dartr
See Also
Other graphics:
gl.colors(),
gl.map.interactive(),
gl.plot.heatmap(),
gl.plot.snp.density(),
gl.select.colors(),
gl.select.shapes(),
gl.tree.nj()
Examples
if (isTRUE(getOption("dartR_fbm"))) testset.gl <- gl.gen2fbm(testset.gl)
gl.smearplot(testset.gl,ind.labels=FALSE)
gl.smearplot(testset.gs,ind.labels=FALSE)
gl.smearplot(testset.gl[1:10,],ind.labels=TRUE)
gl.smearplot(testset.gs[1:10,],ind.labels=TRUE)
Sorts genlight objects by individual, population, or genomic position
Description
Reorders individuals in a genlight object by individual names, population names,
or by chromosome and SNP position. Useful for ensuring meaningful genotype
ordering in visualizations such as gl.smearplot.
Usage
gl.sort(
  x,
  sort.by = "pop",
  order.by = NULL,
  order.by.chr.pos = FALSE,
  verbose = NULL
)
Arguments
x |
Genlight object containing SNP/Silicodart genotypes [required]. |
sort.by |
Specify to sort the genotypes by either 'ind' or 'pop' [default 'pop']. |
order.by |
Vector used to order genotypes [default NULL]. |
order.by.chr.pos |
Whether to order loci first by chromosome and then by SNP position [default FALSE]. |
verbose |
Verbosity: 0, silent or fatal errors; 1, begin and end; 2, progress log; 3, progress and results summary; 5, full report [default 2 or as specified using gl.set.verbosity]. |
Details
This is a function to sort genotypes in a genlight object by individual name, by population name or by chromosome and SNP position. This is useful if you want to visualise the structure across populations (bands) in a gl.smearplot; order of genotypes is important.
The order.by parameter needs to be a vector upon which to effect the sort, of length of nPop(gl) if sort.by is 'pop' or nInd(gl) if sort.by is 'ind'. For sort.by='ind' order.by can be a vector such as a variable in gl@other$ind.metrics.
If not specified by nominating a vector with order.by, alphabetical order of populations or individuals is used.
Ordering by chromosome and SNP position requires that chromosome and
position slots are set in the genlight object.
Value
Returns a reordered genlight object. Sorts also the ind/loc.metrics and coordinates accordingly
Author(s)
Author(s): Bernd Gruber. Custodian: Bernd Gruber (Post to https://groups.google.com/d/forum/dartr)
See Also
Other data manipulation:
gl.add.indmetrics(),
gl.define.pop(),
gl.drop.ind(),
gl.drop.loc(),
gl.drop.pop(),
gl.edit.recode.pop(),
gl.fbm.cleanup(),
gl.fbm2gen(),
gl.gen2fbm(),
gl.impute(),
gl.join(),
gl.keep.ind(),
gl.keep.loc(),
gl.keep.pop(),
gl.make.recode.ind(),
gl.make.recode.pop(),
gl.merge.pop(),
gl.reassign.ind(),
gl.reassign.pop(),
gl.recode.ind(),
gl.recode.pop(),
gl.rename.pop(),
gl.sample(),
gl.sim.genotypes(),
gl.subsample.ind(),
gl.subsample.loc(),
gl.subsample.loci()
Examples
#sort by populations
if (isTRUE(getOption("dartR_fbm"))) bandicoot.gl <- gl.gen2fbm(bandicoot.gl)
bc <- gl.sort(bandicoot.gl)
#sort from West to East
bc2 <- gl.sort(bandicoot.gl, sort.by="pop" ,
order.by=c("WA", "SA", "VIC", "NSW", "QLD"))
#sort by missing values
miss <- rowSums(is.na(as.matrix(bandicoot.gl)))
bc3 <- gl.sort(bandicoot.gl, sort.by="ind", order.by=miss)
gl.smearplot(bc3)
Subsample individuals from a genlight object
Description
A function to subsample individuals at random in a genlight object with and without replacement.
Usage
gl.subsample.ind(
  x,
  n = NULL,
  replace = TRUE,
  by.pop = TRUE,
  error.check = TRUE,
  mono.rm = FALSE,
  verbose = NULL
)
Arguments
x |
Name of the genlight object containing the SNP or presence/absence (SilicoDArT) data [required]. |
n |
Number of individuals to include in the subsample; if NULL, the size of the smallest population (by.pop = TRUE) or nInd(x) [default NULL] |
replace |
If TRUE, sampling is with replacement [default TRUE] |
by.pop |
If FALSE, ignore population settings when subsampling; if TRUE, subsample each population to n individuals [default TRUE]. |
error.check |
If TRUE, will undertake error checks on input paramaters [default TRUE] |
mono.rm |
If TRUE and error.check is TRUE, monomorphic loci arising from the deletion of individuals will be filtered from the resultant genlight object [default FALSE] |
verbose |
Verbosity: 0, silent or fatal errors; 1, begin and end; 2, progress log; 3, progress and results summary; 5, full report [default NULL, unless specified using gl.set.verbosity] |
Details
Retain a subset of individuals at random, with or without replacement. If subsampling globally, n must be less than or equal to nInd(x). If subsampling by population, then n must be less than the minimum sample size for any population.
Set error.check = FALSE for speedy execution in simulations
Value
Returns the subsampled genlight object
Author(s)
Author(s): Bernd Gruber. Custodian: Bernd Gruber (Post to https://groups.google.com/d/forum/dartr)
See Also
Other data manipulation:
gl.add.indmetrics(),
gl.define.pop(),
gl.drop.ind(),
gl.drop.loc(),
gl.drop.pop(),
gl.edit.recode.pop(),
gl.fbm.cleanup(),
gl.fbm2gen(),
gl.gen2fbm(),
gl.impute(),
gl.join(),
gl.keep.ind(),
gl.keep.loc(),
gl.keep.pop(),
gl.make.recode.ind(),
gl.make.recode.pop(),
gl.merge.pop(),
gl.reassign.ind(),
gl.reassign.pop(),
gl.recode.ind(),
gl.recode.pop(),
gl.rename.pop(),
gl.sample(),
gl.sim.genotypes(),
gl.sort(),
gl.subsample.loc(),
gl.subsample.loci()
Examples
if (isTRUE(getOption("dartR_fbm"))) testset.gl <- gl.gen2fbm(testset.gl)
gl <- gl.subsample.ind(testset.gl, n=30, by.pop=FALSE, replace=TRUE)
if (isTRUE(getOption("dartR_fbm"))) platypus.gl <- gl.gen2fbm(platypus.gl)
gl <- gl.subsample.ind(platypus.gl, n=10, by.pop=TRUE, replace=TRUE)
Subsample loci from a genlight object
Description
A function to subsample loci in a genlight object, at random (with or without replacement) or by information content.
Usage
gl.subsample.loc(
  x,
  n,
  replace = TRUE,
  error.check = TRUE,
  method = "random",
  mono.rm = FALSE,
  verbose = NULL
)
Arguments
x |
Name of the genlight object containing the SNP or presence/absence (SilicoDArT) data [required]. |
n |
Number of loci to include in the subsample [required]. |
replace |
If TRUE, sampling is with replacement; ignored when
|
error.check |
If TRUE, will undertake error checks on input parameters [default TRUE] |
method |
Method: "random", in which case the loci are sampled at random; or "pic", in which case the top n loci ranked on information content are chosen. Information content is AvgPIC for SNP data and PIC for presence/absence (SilicoDArT) data, recalculated first if the stored values are out of date [default "random"]. |
mono.rm |
Delete monomorphic loci before sampling [default FALSE]. |
verbose |
Verbosity: 0, silent or fatal errors; 1, begin and end; 2, progress log; 3, progress and results summary; 5, full report [default NULL, unless specified using gl.set.verbosity] |
Details
Retain a subset of loci at random, with or without replacement,
or the n most informative loci. Parameter n must be less than or equal to
nLoc(x) (after monomorphic loci are removed, if mono.rm = TRUE).
Set error.check = FALSE for speedy execution in simulations
Value
Returns the subsampled genlight object
Author(s)
Author(s): Bernd Gruber, Luis Mijangos. Custodian: Bernd Gruber (Post to https://groups.google.com/d/forum/dartr)
See Also
Other data manipulation:
gl.add.indmetrics(),
gl.define.pop(),
gl.drop.ind(),
gl.drop.loc(),
gl.drop.pop(),
gl.edit.recode.pop(),
gl.fbm.cleanup(),
gl.fbm2gen(),
gl.gen2fbm(),
gl.impute(),
gl.join(),
gl.keep.ind(),
gl.keep.loc(),
gl.keep.pop(),
gl.make.recode.ind(),
gl.make.recode.pop(),
gl.merge.pop(),
gl.reassign.ind(),
gl.reassign.pop(),
gl.recode.ind(),
gl.recode.pop(),
gl.rename.pop(),
gl.sample(),
gl.sim.genotypes(),
gl.sort(),
gl.subsample.ind(),
gl.subsample.loci()
Examples
if (isTRUE(getOption("dartR_fbm"))) testset.gl <- gl.gen2fbm(testset.gl)
gl2 <- gl.subsample.loc(testset.gl, n=50, replace=TRUE, verbose=3)
gl3 <- gl.subsample.loc(testset.gl, n=50, method="pic", verbose=3)
Subsamples n loci from a genlight object [deprecated]
Description
Deprecated. Use gl.subsample.loc(x, n, replace = FALSE,
method = method, mono.rm = mono.rm) instead; see
gl.subsample.loc.
Subsamples a genlight object on loci, at random or on information
content, by calling gl.subsample.loc. It will be removed in a
future release.
Usage
gl.subsample.loci(x, n, method = "random", mono.rm = FALSE, verbose = NULL)
Arguments
x |
Name of the genlight object containing the SNP or presence/absence (SilicoDArT) data [required]. |
n |
Number of loci to include in the subsample [required]. |
method |
Method: 'random', in which case the loci are sampled at random; or 'pic', in which case the top n loci ranked on information content are chosen. Information content is AvgPIC in the case of SNP data and PIC in the case of presence/absence (SilicoDArT) data, recalculated first if the stored values are out of date [default 'random']. |
mono.rm |
Delete monomorphic loci before sampling [default FALSE]. |
verbose |
Verbosity: 0, silent or fatal errors; 1, begin and end; 2, progress log; 3, progress and results summary; 5, full report [default 2 or as specified using gl.set.verbosity]. |
Value
A genlight object with n loci
Author(s)
Author(s): Luis Mijangos. Custodian: Luis Mijangos – Post to https://groups.google.com/d/forum/dartr
See Also
Other data manipulation:
gl.add.indmetrics(),
gl.define.pop(),
gl.drop.ind(),
gl.drop.loc(),
gl.drop.pop(),
gl.edit.recode.pop(),
gl.fbm.cleanup(),
gl.fbm2gen(),
gl.gen2fbm(),
gl.impute(),
gl.join(),
gl.keep.ind(),
gl.keep.loc(),
gl.keep.pop(),
gl.make.recode.ind(),
gl.make.recode.pop(),
gl.merge.pop(),
gl.reassign.ind(),
gl.reassign.pop(),
gl.recode.ind(),
gl.recode.pop(),
gl.rename.pop(),
gl.sample(),
gl.sim.genotypes(),
gl.sort(),
gl.subsample.ind(),
gl.subsample.loc()
Examples
# SNP data
gl2 <- gl.subsample.loci(testset.gl, n=200, method='pic')
# Tag P/A data
gl2 <- gl.subsample.loci(testset.gs, n=100, method='random')
Tests the difference in heterozygosity between populations taken pairwise
Description
Tests whether the unbiased expected heterozygosity (uHe) differs between populations, for every pair of populations in a genlight object. The uHe of each population is bootstrapped (resampling individuals or loci, see Details), and for each pair the function returns the observed difference (pop1 - pop2), a bootstrap confidence interval, a significance label and a two-sided p value (raw and Benjamini-Hochberg adjusted across pairs). uHe is corrected for sample size following equation 2 of Nei (1978).
Usage
gl.test.heterozygosity(
  x,
  nreps = 1000,
  boot.method = "ind",
  alpha1 = 0.05,
  alpha2 = 0.01,
  conf = 0.95,
  plot.out = TRUE,
  max_plots = 6,
  plot.theme = theme_dartR(),
  plot.colors = gl.select.colors(ncolors = 2, verbose = 0),
  plot.file = NULL,
  plot.dir = NULL,
  verbose = NULL
)
Arguments
x |
A genlight object containing the SNP genotypes [required]. |
nreps |
Number of bootstrap replicates used to build the sampling distribution of each pairwise difference [default 1,000]. |
boot.method |
Resample across individuals ("ind") or across loci ("loc") when bootstrapping the heterozygosity of each population [default "ind"]. |
alpha1 |
First significance level for the two-sided test of diff=0, used for the significance label and the plot [default 0.05]. |
alpha2 |
Second significance level for the two-sided test of diff=0, used for the significance label and the plot [default 0.01]. |
conf |
Confidence level for the bootstrap confidence interval of each pairwise difference [default 0.95]. |
plot.out |
If TRUE, plots a sampling distribution of the differences for each comparison [default TRUE]. |
max_plots |
Maximum number of plots to print per page [default 6]. |
plot.theme |
Theme for the plot. See Details for options [default theme_dartR()]. |
plot.colors |
List of two color names for the borders and fill of the plots [default gl.select.colors(ncolors = 2, verbose = 0)]. |
plot.file |
Base name (no extension) for the RDS files that save each page of plots and the result table; see Details [default NULL] |
plot.dir |
Directory to save the plot RDS files [default as specified by the global working directory or tempdir()] |
verbose |
Verbosity: 0, silent or fatal errors; 1, begin and end; 2, brief progress messages; 3, progress and results summary; 5, full report [default 2, unless specified using gl.set.verbosity]. |
Details
Choosing the resampling unit (boot.method)
The uHe of each population is bootstrapped with the same engine as
gl.report.heterozygosity, and boot.method sets what is
resampled. The two units answer different questions and can yield different
confidence intervals and p values for the same data:
-
"ind"(default) resamples individuals. It treats the sampled individuals as a sample of each population and tests whether the two populations differ in heterozygosity. This is the usual question. -
"loc"resamples loci, with the individuals held fixed. It tests whether the genome-wide difference is consistent across loci rather than driven by a few of them, and does not generalise to the populations the individuals came from. Use it only when the individuals are effectively a census of each group (for example a fully sampled captive lineage or a complete cohort), where there is no individual-sampling variance to account for; with a sample of individuals from each population, use"ind".
For "loc" the loci are resampled independently within each population
and treated as independent, so the interval ignores linkage and is
approximate.
Interpreting the plot
With plot.out = TRUE one histogram is drawn per pair of populations.
The histogram is the bootstrap distribution of the difference in uHe
(pop1 - pop2), with four vertical lines:
green: the observed difference.
blue: zero (no difference).
two dark red lines: the significance limits at level
alpha1(default 0.05).two bright red lines: the limits at level
alpha2(default 0.01).
The red lines are the alpha/2 and 1 - alpha/2 quantiles of
the bootstrap distribution, so they bound a two-sided test at each level.
Read significance from the blue zero line, not the green one. If zero lies
outside the red lines of a given level, the difference is significant at that
level; if it lies inside the alpha1 lines, the difference is not
significant. The significance label and the p value in the table are
computed the same way and agree with each other, except that the p value
cannot fall below 2 / (nreps + 1): with few replicates a pair can carry
the stricter label while its p value stays at that floor, so use
nreps of 1000 or more when the p values matter. The green observed line sits near the centre of its own bootstrap
distribution by construction, so its position is not the test. Each panel
subtitle gives the significance label and the p value.
Saving the plot
If plot.file is given, each page of plots is saved as an RDS file
named <plot.file>_<first pair>_to_<last pair>.RDS, and the result
table as table_<plot.file>.RDS; both can be reloaded with
readRDS(). They are written to plot.dir if given, otherwise
to tempdir(). Other ggplot themes
can be consulted at
https://ggplot2.tidyverse.org/reference/ggtheme.html and
https://yutannihilation.github.io/allYourFigureAreBelongToUs/ggthemes/.
Value
A dataframe with one row per population pair containing the two population labels, the observed difference in unbiased expected heterozygosity (pop1 - pop2), the lower and upper bounds of its bootstrap confidence interval, the significance label and the two-sided bootstrap p value (raw and Benjamini-Hochberg adjusted).
Author(s)
Author(s): Arthur Georges, Luis Mijangos. Custodian: Luis Mijangos – Post to https://groups.google.com/d/forum/dartr
References
Nei, M. (1978). Estimation of average heterozygosity and genetic distance from a small number of individuals. Genetics, 89(3), 583-590.
Examples
if (isTRUE(getOption("dartR_fbm"))) platypus.gl <- gl.gen2fbm(platypus.gl)
out <- gl.test.heterozygosity(platypus.gl, nreps=100, verbose=3, plot.out=TRUE)
Generates a Fitch-Margoliash distance phylogeny
Description
Generates a distance phylogeny from a distance object using the Fitch-Margoliash weighted least-squares method implemented by program fitch in the Phylip suite of executables, optionally with bootstrap support values computed by resampling loci from the genlight object.
Usage
gl.tree.fitch(
  D,
  x = NULL,
  phylip.path,
  out.path = tempdir(),
  tree.method = "FM",
  outgroup = NULL,
  global.rearrange = FALSE,
  randomize = FALSE,
  n.jumble = 9,
  bstrap = 1,
  subst.model = "F81",
  pairwise.missing = TRUE,
  min.tag.len = NULL,
  plot.display = TRUE,
  plot.type = "phylogram",
  bstrap.threshold = 0.8,
  branch.width = 2,
  branch.color = "blue",
  node.label.color = "red",
  terminal.label.cex = 0.8,
  node.label.cex = 0.8,
  offset = 1.2,
  verbose = NULL
)
Arguments
D |
Name of the distance matrix for tree building [required] |
x |
Name of the genlight object containing the SNP data [required for bootstrapping, default NULL]. |
phylip.path |
Path to the directory that holds the Phylip executables [required]. |
out.path |
Path to the directory to save files produced by the analysis [default tempdir()] |
tree.method |
Algorithm used for constructing trees and selecting the best tree; only "FM" (Fitch-Margoliash) is implemented [default "FM"] |
outgroup |
Name of the outgroup taxon; if supplied, the returned tree is rooted on it [default NULL, no outgroup, tree not rooted] |
global.rearrange |
If TRUE, undertake global rearrangements when generating the tree [default FALSE]. |
randomize |
If TRUE, randomize the order of the input taxa [default FALSE]. |
n.jumble |
Number of randomizations of the input order, must be odd [default 9] |
bstrap |
Number of bootstrap replicates [default 1, no bootstrapping] |
subst.model |
The substitution model used by gl.dist.phylo() when recomputing distances for the bootstrap replicates; set to the model used to build D [default "F81"] |
pairwise.missing |
Whether gl.dist.phylo() deletes sites with missing data pairwise when recomputing distances for the bootstrap replicates; set to the value used to build D [default TRUE] |
min.tag.len |
Minimum tag length applied by gl.dist.phylo() when recomputing distances for the bootstrap replicates; set to the value used to build D [default NULL] |
plot.display |
If TRUE, the tree is plotted in the plot window [default TRUE] |
plot.type |
One of 'phylogram','cladogram','unrooted','fan','tidy','radial' [default "phylogram"] |
bstrap.threshold |
Threshold for bootstrap values to be displayed on the tree [default 0.8] |
branch.width |
Width of the branches [default 2] |
branch.color |
Colour of the branches [default "blue"] |
node.label.color |
Colour of the node labels [default "red"] |
terminal.label.cex |
Height of the taxon label text [default 0.8] |
node.label.cex |
Height of the node label text [default 0.8] |
offset |
Horizontal offset of the node labels from the node [default 1.2] |
verbose |
Verbosity: 0, silent or fatal errors; 1, begin and end; 2, progress log; 3, progress and results summary; 5, full report [default NULL, adopting the global verbosity set by gl.set.verbosity(), or 2 if no global is set]. |
Details
The script takes a distance object as input. This distance object is typically created with gl.dist.phylo(). The script writes the distance matrix to a file in the format expected by program fitch in the Phylip suite of executables, then runs fitch to generate the best tree by the Fitch-Margoliash method – weighted least-squares fitting of branch lengths to the distances (power 2, negative branch lengths disallowed). This is a distance method, not maximum parsimony.
Program fitch requires at least four taxa, and taxon names are truncated to the 10 characters of the Phylip format (execution stops if the truncated names are not unique). The Phylip tree file carries branch lengths to 6 decimal places only, which would leave SNP-scale distances with one or two significant digits; the distance matrix is therefore scaled by 10,000 before it is passed to fitch and the branch lengths are rescaled on return. The Fitch-Margoliash criterion is invariant to this scaling, so the topology and relative branch lengths are unaffected.
tree.method : Currently only Fitch-Margoliash is implemented.
outgroup : Name the taxon to be used as outgroup. Must be among the names of the populations defined in the genlight object. When supplied, the returned tree is rooted on the outgroup.
If bstrap > 1, bootstrap replicates are generated by resampling loci with replacement from the genlight object x, and distances for each replicate are recomputed with gl.dist.phylo() using the settings given by subst.model, pairwise.missing and min.tag.len – set these to the values used to build D, otherwise the support values will measure the stability of trees built under a different model. The support for each node of the best tree is the proportion of replicate trees that contain the same bipartition (computed with ape::prop.clades) and is attached to the returned tree as node.label; the Phylip majority-rule consensus tree from consense is attached as attribute "consensus.tree". The seeds for the Phylip-side searches are fixed (12345 for the jumbled input order, 331 for the replicate analyses); global.rearrange and randomize apply to the search for the best tree only, not to the replicate searches; and the locus resampling is governed by the R session's random number generator (use set.seed() for reproducibility).
Value
A tree of class phylo. When bstrap > 1, node.label carries the bootstrap support proportions for the corresponding internal nodes and the Phylip majority-rule consensus tree is attached as attribute "consensus.tree".
Author(s)
Author(s): Arthur Georges. Custodian: Arthur Georges – Post to https://groups.google.com/d/forum/dartr
See Also
Other phylogeny:
gl.dist.phylo()
Examples
## Not run:
if (isTRUE(getOption("dartR_fbm"))) testset.gl <- gl.gen2fbm(testset.gl)
tmp <- gl.filter.monomorphs(testset.gl)
D <- gl.dist.phylo(testset.gl,subst.model="F81")
gl.tree.fitch(D=D,x=tmp,phylip.path="D:/workspace/R/phylip-3.695/exe",plot.type="unrooted",
node.label.cex=0.5,terminal.label.cex=0.6,global.rearrange = FALSE, bstrap=10)

## End(Not run)
Outputs a tree to summarize genetic similarity among populations (e.g. phenogram)
Description
This function is a wrapper for the nj function in package ape (and, for method='upgma', the hclust function in stats) applied to Euclidean distances calculated from the genlight object.
Usage
gl.tree.nj(
  x,
  dist.matrix = NULL,
  method = "nj",
  by.pop = TRUE,
  as.pop = NULL,
  type = "phylogram",
  outgroup = NULL,
  labelsize = 0.7,
  treefile = NULL,
  plot.display = TRUE,
  verbose = NULL
)
Arguments
x |
Name of the genlight object containing the SNP data [required]. |
dist.matrix |
Distance matrix [default NULL]. |
method |
Clustering method – nj, neighbour-joining tree; upgma, UPGMA tree [default 'nj']. |
by.pop |
If TRUE, populations are the terminal taxa; if FALSE, individuals are the terminal taxa [default TRUE]. |
as.pop |
Assign another ind.metric as the population for the purposes of displaying more informative tip labels [default NULL]. |
type |
Type of dendrogram "phylogram"|"cladogram"|"fan"|"unrooted"|"radial"|"tidy" [default "phylogram"]. |
outgroup |
Vector containing the population names that are the outgroups [default NULL]. |
labelsize |
Size of the labels as a proportion of the graphics default [default 0.7]. |
treefile |
Name of the file for the tree topology using Newick format [default NULL]. |
plot.display |
If TRUE, the tree is plotted in the plot window [default TRUE]. |
verbose |
Verbosity: 0, silent or fatal errors; 1, begin and end; 2, progress log; 3, progress and results summary; 5, full report [default NULL, adopting the global verbosity set by gl.set.verbosity(), or 2 if no global is set]. |
Details
A Euclidean distance matrix is calculated by default [dist.matrix = NULL]
from allele frequencies computed for each population at each locus,
excluding missing genotypes. Frequencies are scaled by ploidy, so SNP
(0/1/2) and Tag P/A (0/1) data both yield frequencies in the range 0 to 1.
Optionally the user can use as input for the tree any other distance
matrix using this parameter, see for example the function
gl.dist.pop.
The tree is built with the neighbour-joining algorithm [method='nj'] or by UPGMA clustering [method='upgma']; the legacy spelling 'ugpma' is accepted as a synonym of 'upgma'. If an outgroup is specified, the tree is rooted on that outgroup with the root resolved.
The tree is computed and returned whether or not it is plotted; a failure in plotting does not affect the returned tree.
Value
A tree of class phylo. If treefile is specified, the tree is also written to that file in Newick format.
Author(s)
Author(s): Arthur Georges. Custodian: Arthur Georges – Post to https://groups.google.com/d/forum/dartr
See Also
Other graphics:
gl.colors(),
gl.map.interactive(),
gl.plot.heatmap(),
gl.plot.snp.density(),
gl.select.colors(),
gl.select.shapes(),
gl.smearplot()
Examples
# SNP data
if (isTRUE(getOption("dartR_fbm"))) testset.gl <- gl.gen2fbm(testset.gl)
  gl.tree.nj(testset.gl,type='fan')
# Tag P/A data
  gl.tree.nj(testset.gs,type='fan')
  res <- gl.tree.nj(platypus.gl)
Writes out data from a genlight object to csv file
Description
This script writes to file the SNP genotypes with specimens as entities (columns) and loci as attributes (rows). Each row has associated locus metadata. Each column, with header of specimen id, has population in the first row. For SNP data the coding differs from the DArT 1row format in that 0 = reference homozygous, 2 = alternate homozygous, 1 = heterozygous, and NA = missing SNP assignment. For SilicoDArT (presence-absence) data the values written are 0 = absent, 1 = present, and NA = missing.
Usage
gl.write.csv(x, outfile = "outfile.csv", outpath = tempdir(), verbose = NULL)
Arguments
x |
Name of the genlight object containing the SNP or SilicoDArT data [required]. |
outfile |
File name of the output file (including extension) [default "outfile.csv"]. |
outpath |
Path where to save the output file [default tempdir(), mandated by CRAN]. Use outpath=getwd() or outpath='.' when calling this function to direct output files to your working directory. |
verbose |
Verbosity: 0, silent or fatal errors; 1, begin and end; 2, progress log; 3, progress and results summary; 5, full report [default NULL, adopting the global verbosity set by gl.set.verbosity(), or 2 if no global is set]. |
Value
Saves a genlight object to csv, returns NULL.
Author(s)
Author(s): Arthur Georges. Custodian: Arthur Georges – Post to https://groups.google.com/d/forum/dartr
See Also
Other io:
gl.load(),
gl.read.PLINK(),
gl.read.csv(),
gl.read.dart(),
gl.read.fasta(),
gl.read.silicodart(),
gl.save(),
utils.read.dart()
Examples
# SNP data
if (isTRUE(getOption("dartR_fbm"))) testset.gl <- gl.gen2fbm(testset.gl)
  gl.write.csv(testset.gl, outfile='SNP_1row.csv')
# Tag P/A data
  gl.write.csv(testset.gs, outfile='PA_1row.csv')
Converts a genlight object into bayesAss (BA3) input format
Description
This function exports a genlight object into bayesAss format and saves it
into a file.
This function only caters for ploidy = 2.
Usage
gl2bayesAss(
  x,
  ploidy = 2,
  outfile = "gl.BayesAss.txt",
  outpath = NULL,
  verbose = NULL
)
Arguments
x |
Name of the genlight object containing the SNP data [required]. |
ploidy |
Confirmation that the data are diploid; 2 is the only accepted value, other values stop the function [default 2]. |
outfile |
File name of the output file [default 'gl.BayesAss.txt']. |
outpath |
Path where to save the output file [default global working directory or if not specified, tempdir()]. |
verbose |
Verbosity: 0, silent or fatal errors; 1, begin and end; 2, progress log; 3, progress and results summary; 5, full report [default NULL, adopting the global verbosity set by gl.set.verbosity(), or 2 if no global is set]. |
Details
The output file has one row per individual per locus, in the format expected by BayesAss (BA3) and BA3-SNPs: individual identifier, population, locus name, then the two alleles coded as 1 (reference) and 2 (alternate). Missing genotypes are written as 0 0.
Value
returns the input file as data.table
Author(s)
Author(s): Carlo Pacioni. Custodian: Carlo Pacioni – Post to https://groups.google.com/d/forum/dartr
References
Mussmann S. M., Douglas M. R., Chafin T. K. and Douglas M. E. (2019) BA3-SNPs: Contemporary migration reconfigured in BayesAss for next-generation sequence data. Methods in Ecology and Evolution 10, 1808-1813.
Wilson G. A. and Rannala B. (2003) Bayesian Inference of Recent Migration Rates Using Multilocus Genotypes. Genetics 163, 1177-1191.
See Also
Other linker:
gi2gl(),
gl2bayescan(),
gl2bpp(),
gl2demerelate(),
gl2eigenstrat(),
gl2faststructure(),
gl2gapit(),
gl2gds(),
gl2genalex(),
gl2genepop(),
gl2geno(),
gl2gi(),
gl2hapmap(),
gl2hiphop(),
gl2related(),
gl2snapper(),
gl2structure(),
gl2treemix(),
gl2vcf()
Examples
require("dartR.data")
#only the first 100 due to check time
if (isTRUE(getOption("dartR_fbm"))) platypus.gl <- gl.gen2fbm(platypus.gl)
gl2bayesAss(platypus.gl[,1:100], outpath=tempdir())
Converts a genlight object into a format suitable for input to Bayescan
Description
The output text file contains the SNP data and relevant BayeScan command lines to guide input.
Usage
gl2bayescan(x, outfile = "bayescan.txt", outpath = NULL, verbose = NULL)
Arguments
x |
Name of the genlight object containing the SNP data [required]. |
outfile |
File name of the output file (including extension) [default bayescan.txt]. |
outpath |
Path where to save the output file [default global working directory or if not specified, tempdir()]. |
verbose |
Verbosity: 0, silent or fatal errors; 1, begin and end; 2, progress log; 3, progress and results summary; 5, full report [default NULL, adopting the global verbosity set by gl.set.verbosity(), or 2 if no global is set]. |
Details
The output follows BayeScan's codominant (GESTE) format: for each
population, one row per locus giving the number of gene copies sampled,
the number of alleles (2), and the counts of the alternate and reference
alleles. A population x locus combination with no genotyped individuals
is written as a sample of zero gene copies; a warning reports how many
such rows were written. Filtering on call rate
(gl.filter.callrate) before export is recommended to avoid empty
samples.
Value
returns no value (i.e. NULL), invisibly
Author(s)
Author(s): Luis Mijangos. Custodian: Luis Mijangos – Post to https://groups.google.com/d/forum/dartr
References
Foll M and OE Gaggiotti (2008) A genome scan method to identify selected loci appropriate for both dominant and codominant markers: A Bayesian perspective. Genetics 180: 977-993.
See Also
Other linker:
gi2gl(),
gl2bayesAss(),
gl2bpp(),
gl2demerelate(),
gl2eigenstrat(),
gl2faststructure(),
gl2gapit(),
gl2gds(),
gl2genalex(),
gl2genepop(),
gl2geno(),
gl2gi(),
gl2hapmap(),
gl2hiphop(),
gl2related(),
gl2snapper(),
gl2structure(),
gl2treemix(),
gl2vcf()
Examples
if (isTRUE(getOption("dartR_fbm"))) testset.gl <- gl.gen2fbm(testset.gl)
out <- gl2bayescan(testset.gl, outpath = tempdir())
Converts a genlight object into a format suitable for input to the BPP program
Description
This function generates the sequence alignment file and the Imap file. The
control file should produced by the user.
If method = 1, heterozygous positions are replaced by standard ambiguity
codes.
If method = 2, the heterozygous state is resolved by randomly assigning one
or the other SNP variant to the individual.
Trimmed sequences for which the SNP has been trimmed out, rarely, by adapter
mis-identity are deleted.
This function requires 'TrimmedSequence' and 'SnpPosition' (the 0-based
position of the SNP within the sequence tag) to be among the locus
metrics (@other$loc.metrics) and information of the type of
alleles in slot loc.all (e.g. 'G/A').
Usage
gl2bpp(
  x,
  method = 1,
  merge.secondaries = FALSE,
  outfile = "output_bpp.txt",
  imap = "Imap.txt",
  outpath = NULL,
  verbose = NULL
)
Arguments
x |
Name of the genlight object containing the SNP data [required]. |
method |
One of 1 | 2, see details [default 1]. |
merge.secondaries |
Logical, if TRUE, secondary loci are merged into a single sequence [default FALSE]. |
outfile |
Name of the saved sequence alignment file [default 'output_bpp.txt']. |
imap |
Name of the saved Imap file [default 'Imap.txt']. |
outpath |
Path where to save the output file [default global working directory or if not specified, tempdir()]. |
verbose |
Verbosity: 0, silent or fatal errors; 1, begin and end; 2, progress log; 3, progress and results summary; 5, full report [default NULL, adopting the global verbosity set by gl.set.verbosity(), or 2 if no global is set]. |
Details
It's important to keep in mind that analyses based on coalescent theory, like those done by the programme BPP, are meant to be used with sequence data. In this type of data, large chunks of DNA are sequenced, so when we find polymorphic sites along the sequence, we know they are all on the same chromosome. This kind of data, in which we know which chromosome each allele comes from, is called "phased data." Most data from reduced representation genome-sequencing methods, like DArTseq, is unphased, which means that we don't know which chromosome each allele comes from. So, if we apply coalescence theory to data that is not phased, we will get biased results. As in Ellegren et al., one way to deal with this is to "haplodize" each genotype by randomly choosing one allele from heterozygous genotypes (2012) by using method = 2.
Be mindful that there is little information in the literature on the validity of this method.
Value
returns no value (i.e. NULL), invisibly
Author(s)
Author(s): Luis Mijangos. Custodian: Luis Mijangos – Post to https://groups.google.com/d/forum/dartr
References
Ellegren, Hans, et al. "The genomic landscape of species divergence in Ficedula flycatchers." Nature 491.7426 (2012): 756-760.
Flouri T., Jiao X., Rannala B., Yang Z. (2018) Species Tree Inference with BPP using Genomic Sequences and the Multispecies Coalescent. Molecular Biology and Evolution, 35(10):2585-2593. doi:10.1093/molbev/msy147
See Also
Other linker:
gi2gl(),
gl2bayesAss(),
gl2bayescan(),
gl2demerelate(),
gl2eigenstrat(),
gl2faststructure(),
gl2gapit(),
gl2gds(),
gl2genalex(),
gl2genepop(),
gl2geno(),
gl2gi(),
gl2hapmap(),
gl2hiphop(),
gl2related(),
gl2snapper(),
gl2structure(),
gl2treemix(),
gl2vcf()
Examples
require(dartR.data)
if (isTRUE(getOption("dartR_fbm"))) testset.gl <- gl.gen2fbm(testset.gl)
test <- gl.filter.callrate(testset.gl,threshold = 1)
test <- gl.filter.monomorphs(test)
test <- gl.subsample.loc(test,n=50)
gl2bpp(x = test, outpath=tempdir())
Creates a dataframe suitable for input to package {Demerelate} from a genlight {adegenet} object
Description
Converts a genlight object containing SNP data into a dataframe in the format expected by package {Demerelate} for estimating pairwise relatedness: one row per individual, with the sample identifier and population followed by two adjacent allele columns per locus.
Usage
gl2demerelate(x, verbose = NULL)
Arguments
x |
Name of the genlight object containing the SNP data [required]. |
verbose |
Verbosity: 0, silent or fatal errors; 1, begin and end; 2, progress log; 3, progress and results summary; 5, full report [default NULL, adopting the global verbosity set by gl.set.verbosity(), or 2 if no global is set]. |
Details
Each SNP genotype is recoded as a pair of alleles labelled 1 (reference) and 2 (alternate): 0 becomes 1/1, 1 becomes 1/2, 2 becomes 2/2, and missing genotypes are retained as NA in both allele columns, which Demerelate reads as missing. The two allele columns for each locus are suffixed _1 and _2 and kept adjacent. Locus names are sanitized for Demerelate: '-' and '|' are replaced with '_' and '/' is removed.
Value
A dataframe suitable as input to package {Demerelate}
Author(s)
Author(s): Luis Mijangos. Custodian: Luis Mijangos – Post to https://groups.google.com/d/forum/dartr
See Also
Other linker:
gi2gl(),
gl2bayesAss(),
gl2bayescan(),
gl2bpp(),
gl2eigenstrat(),
gl2faststructure(),
gl2gapit(),
gl2gds(),
gl2genalex(),
gl2genepop(),
gl2geno(),
gl2gi(),
gl2hapmap(),
gl2hiphop(),
gl2related(),
gl2snapper(),
gl2structure(),
gl2treemix(),
gl2vcf()
Examples
if (isTRUE(getOption("dartR_fbm"))) testset.gl <- gl.gen2fbm(testset.gl)
df <- gl2demerelate(testset.gl)
Converts a genlight object into eigenstrat format
Description
The output of this function are three files:
genotype file: contains genotype data for each individual at each SNP with an extension 'eigenstratgeno.'
snp file: contains information about each SNP with an extension 'snp.'
indiv file: contains information about each individual with an extension 'ind.'
Usage
gl2eigenstrat(
  x,
  outfile = "gl_eigenstrat",
  outpath = NULL,
  snp.pos = 1,
  snp.chr = 1,
  pos.cM = 0,
  sex.code = "unknown",
  phen.value = "Case",
  verbose = NULL
)
Arguments
x |
Name of the genlight object containing the SNP data [required]. |
outfile |
File name of the output file [default 'gl_eigenstrat']. |
outpath |
Path where to save the output file [default global working directory or if not specified, tempdir()]. |
snp.pos |
Field name from the slot loc.metrics where the SNP position is stored; when left at the numeric sentinel 1, a constant position of 1 is written for every SNP [default 1]. |
snp.chr |
Field name from the slot loc.metrics where the chromosome of each SNP is stored; when left at the numeric sentinel 1, a constant chromosome of 1 is written for every SNP [default 1]. |
pos.cM |
A vector, with as many elements as there are loci, containing the SNP position in morgans or centimorgans; the default writes 0 (unknown) for every SNP [default 0]. |
sex.code |
A vector, with as many elements as there are individuals, containing the sex code ('male', 'female', 'unknown') [default 'unknown']. |
phen.value |
A vector, with as many elements as there are individuals, containing the phenotype value ('Case', 'Control') [default 'Case']. |
verbose |
Verbosity: 0, silent or fatal errors; 1, begin and end; 2, progress log; 3, progress and results summary; 5, full report [default NULL, adopting the global verbosity set by gl.set.verbosity(), or 2 if no global is set]. |
Details
Each value in the genotype file is the number of copies of the reference
allele – the first allele of loc.all, written in the fifth column
of the snp file: 2 homozygous reference, 1 heterozygous, 0 homozygous
alternate, 9 missing.
Eigenstrat only accepts chromosomes coded as numeric values, as follows: X chromosome is encoded as 23, Y is encoded as 24, mtDNA is encoded as 90, and XY is encoded as 91. Chromosome labels 'X', 'Y', 'MT'/'mtDNA' and 'XY' in the nominated field are mapped to this encoding; SNPs with illegal chromosome values (any other non-numeric label, or a value less than 1, such as 0) are removed, with a warning stating how many. If no locus has an encodable chromosome value, the function stops.
Value
returns no value (i.e. NULL)
Author(s)
Author(s): Luis Mijangos. Custodian: Luis Mijangos – Post to https://groups.google.com/d/forum/dartr
References
Patterson, N., Price, A. L., & Reich, D. (2006). Population structure and eigenanalysis. PLoS genetics, 2(12), e190.
Price, A. L., Patterson, N. J., Plenge, R. M., Weinblatt, M. E., Shadick, N. A., & Reich, D. (2006). Principal components analysis corrects for stratification in genome-wide association studies. Nature genetics, 38(8), 904-909.
See Also
Other linker:
gi2gl(),
gl2bayesAss(),
gl2bayescan(),
gl2bpp(),
gl2demerelate(),
gl2faststructure(),
gl2gapit(),
gl2gds(),
gl2genalex(),
gl2genepop(),
gl2geno(),
gl2gi(),
gl2hapmap(),
gl2hiphop(),
gl2related(),
gl2snapper(),
gl2structure(),
gl2treemix(),
gl2vcf()
Examples
require("dartR.data")
if (isTRUE(getOption("dartR_fbm"))) platypus.gl <- gl.gen2fbm(platypus.gl)
# The platypus chromosome labels (e.g. 'NC_041731.1_chromosome_4') cannot
# be encoded for Eigenstrat, so the chromosome field is left at its
# constant default
gl2eigenstrat(platypus.gl,snp.pos='ChromPos_Platypus_Chrom_NCBIv1',
outpath=tempdir())
Concatenates DArT trimmed sequences and outputs a FASTA file
Description
Concatenated sequence tags are useful for phylogenetic methods where information on base frequencies and transition and transversion ratios are required (for example, Maximum Likelihood methods). Where relevant, heterozygous loci are resolved before concatenation by either assigning ambiguity codes or by random allele assignment.
Usage
gl2fasta(
x,
method = 1,
outfile = "output.fasta",
outpath = tempdir(),
probar = FALSE,
verbose = NULL
)
Arguments
x |
Name of the genlight object containing the SNP data [required]. |
method |
One of 1 | 2 | 3 | 4. Type method=0 for a list of options [method=1]. |
outfile |
Name of the output file (fasta format) ["output.fasta"]. |
outpath |
Path where to save the output file (set to tempdir by default) |
probar |
If TRUE, a progress bar will be displayed for long loops [default = TRUE]. |
verbose |
Verbosity: 0, silent or fatal errors; 1, begin and end; 2, progress log; 3, progress and results summary; 5, full report [default 2 or as specified using gl.set.verbosity]. |
Details
Four methods are employed:
Method 1 – heterozygous positions are replaced by the standard ambiguity codes. The resultant sequence fragments are concatenated across loci to generate a single combined sequence to be used in subsequent ML phylogenetic analyses.
Method 2 – the heterozygous state is resolved by randomly assigning one or the other SNP variant to the individual. The resultant sequence fragments are concatenated across loci to generate a single composite haplotype to be used in subsequent ML phylogenetic analyses.
Method 3 – heterozygous positions are replaced by the standard ambiguity codes. The resultant SNP bases are concatenated across loci to generate a single combined sequence to be used in subsequent MP phylogenetic analyses.
Method 4 – the heterozygous state is resolved by randomly assigning one or the other SNP variant to the individual. The resultant SNP bases are concatenated across loci to generate a single composite haplotype to be used in subsequent MP phylogenetic analyses.
Trimmed sequences for which the SNP has been trimmed out, rarely, by adapter mis-identity are deleted.
The script writes out the composite haplotypes for each individual as a
fastA file. Requires 'TrimmedSequence' and 'SnpPosition' (the 0-based
position of the SNP within the sequence tag) to be among the locus
metrics (@other$loc.metrics) and information of the type of
alleles in slot loc.all (e.g. 'G/A').
Value
NULL, invisibly. The FASTA file is written to outpath.
Author(s)
Custodian: Luis Mijangos (Post to https://groups.google.com/d/forum/dartr)
Examples
if (isTRUE(getOption("dartR_fbm"))) testset.gl <- gl.gen2fbm(testset.gl)
gl <- gl.filter.reproducibility(testset.gl,t=1)
gl <- gl.filter.overshoot(gl,verbose=3)
gl <- gl.filter.callrate(testset.gl,t=.98)
gl <- gl.filter.monomorphs(gl)
gl2fasta(gl, method=1, outfile='test.fasta',verbose=3)
Converts a genlight object into faststructure format (to run faststructure elsewhere)
Description
Recodes in the quite specific faststructure format (e.g first six columns need to be there, but are ignored...check faststructure documentation (if you find any :-( ))) The script writes out the a file in faststructure format.
Usage
gl2faststructure(
x,
outfile = "gl.str",
outpath = NULL,
probar = FALSE,
verbose = NULL
)
Arguments
x |
Name of the genlight object containing the SNP data [required]. |
outfile |
File name of the output file (including extension) [default "gl.str"]. |
outpath |
Path where to save the output file [default global working directory or if not specified, tempdir()]. |
probar |
Switch to show/hide progress bar [default FALSE]. |
verbose |
Verbosity: 0, silent or fatal errors; 1, begin and end; 2, progress log; 3, progress and results summary; 5, full report [default NULL, adopting the global verbosity set by gl.set.verbosity(), or 2 if no global is set]. |
Details
The output file contains two rows per individual (one per allele), with six leading columns that faststructure requires but ignores; this function fills them with the individual's row index. Genotypes are coded 1/2 per allele and missing data as -9.
Value
returns no value (i.e. NULL)
Author(s)
Author(s): Bernd Gruber. Custodian: Bernd Gruber – Post to https://groups.google.com/d/forum/dartr
See Also
Other linker:
gi2gl(),
gl2bayesAss(),
gl2bayescan(),
gl2bpp(),
gl2demerelate(),
gl2eigenstrat(),
gl2gapit(),
gl2gds(),
gl2genalex(),
gl2genepop(),
gl2geno(),
gl2gi(),
gl2hapmap(),
gl2hiphop(),
gl2related(),
gl2snapper(),
gl2structure(),
gl2treemix(),
gl2vcf()
Examples
gl2faststructure(testset.gl, outfile = "testset.str", outpath = tempdir())
Converts a genlight object into a format suitable for input to GAPIT
Description
Converts a genlight object containing SNP data into a hapmap-style data.frame as expected by GAPIT (Genome Association and Prediction Integrated Tool) and writes it to file as tab-delimited text.
Usage
gl2gapit(x, outfile = "gl_gapit", outpath = NULL, verbose = NULL)
Arguments
x |
Name of the genlight object containing the SNP data [required]. |
outfile |
File name of the output file [default 'gl_gapit']. |
outpath |
Path where to save the output file [default global working directory or if not specified, tempdir()]. |
verbose |
Verbosity: 0, silent or fatal errors; 1, begin and end; 2, progress log; 3, progress and results summary; 5, full report [default NULL, adopting the global verbosity set by gl.set.verbosity(), or 2 if no global is set]. |
Details
The returned data.frame follows the hapmap layout that GAPIT reads with header = FALSE: the first row repeats the column names, the first eleven columns are the hapmap descriptors (rs, alleles, chrom, pos, strand, assembly, center, protLSID, assayLSID, panel, QCcode) and each remaining column carries one individual. Genotypes double the allele letters (for example CC, CT) and missing data is coded 00.
Chromosome names are recoded to integer codes assigned in alphabetical order of the distinct names; the name-to-code mapping is reported at verbose >= 2. If the chromosome or position slot is empty, dummy values are used (chromosome 1 for all loci; positions 1 to the number of loci) with a warning at verbose >= 2.
The data.frame is written to file.path(outpath, outfile) as tab-delimited text without quotes, ready for GAPIT to read.
Value
The hapmap-style data.frame, returned invisibly.
Author(s)
Author(s): Luis Mijangos. Custodian: Luis Mijangos – Post to https://groups.google.com/d/forum/dartr
See Also
Other linker:
gi2gl(),
gl2bayesAss(),
gl2bayescan(),
gl2bpp(),
gl2demerelate(),
gl2eigenstrat(),
gl2faststructure(),
gl2gds(),
gl2genalex(),
gl2genepop(),
gl2geno(),
gl2gi(),
gl2hapmap(),
gl2hiphop(),
gl2related(),
gl2snapper(),
gl2structure(),
gl2treemix(),
gl2vcf()
Examples
t1 <- platypus.gl
# assigning chromosome
t1$chromosome <- t1$other$loc.metrics$Chrom_Platypus_Chrom_NCBIv1
# assigning SNP position
t1$position <- t1$other$loc.metrics$ChromPos_Platypus_Chrom_NCBIv1
res <- gl2gapit(t1, outpath = tempdir())
Converts a genlight object into gds format
Description
Package SNPRelate relies on a bit-level representation of a SNP dataset that competes with {adegenet} genlight objects and associated files. This function converts a genlight object to a gds format file.
Usage
gl2gds(
x,
outfile = "gl_gds.gds",
outpath = NULL,
snp.pos = "0",
snp.chr = "0",
chr.format = "character",
verbose = NULL
)
Arguments
x |
Name of the genlight object containing the SNP data [required]. |
outfile |
File name of the output file (including extension) [default 'gl_gds.gds']. |
outpath |
Path where to save the output file [default global working directory or if not specified, tempdir()]. |
snp.pos |
Field name from the slot loc.metrics where the SNP position is stored [default '0']. |
snp.chr |
Field name from the slot loc.metrics where the chromosome of each is stored [default '0']. |
chr.format |
Whether chromosome information is stored as 'numeric' or as 'character', see details [default 'character']. |
verbose |
Verbosity: 0, silent or fatal errors; 1, begin and end; 2, progress log; 3, progress and results summary; 5, full report [default NULL, adopting the global verbosity set by gl.set.verbosity(), or 2 if no global is set]. |
Details
This function orders the SNPS by chromosome and by position before converting to SNPRelate format, as required by this package. The chromosome of each SNP can be a character or numeric, as described in the vignette of SNPRelate: 'snp.chromosome, an integer or character mapping for each chromosome. Integer: numeric values 1-26, mapped in order from 1-22, 23=X, 24=XY (the pseudoautosomal region), 25=Y, 26=M (the mitochondrial probes), and 0 for probes with unknown positions; it does not allow NA. Character: “X”, “XY”, “Y” and “M” can be used here, and a blank string indicating unknown position.' When using some functions from package SNPRelate with datasets other than humans it might be necessary to use the option autosome.only=FALSE to avoid detecting chromosome coding. So, it is important to read the documentation of the function before using it. The chromosome information for unmapped SNPS is coded as 0, as required by SNPRelate. Remember to close the GDS file before working in a different GDS object with the function snpgdsClose (package SNPRelate).
Value
returns no value (i.e. NULL)
Author(s)
Author(s): Luis Mijangos. Custodian: Luis Mijangos – Post to https://groups.google.com/d/forum/dartr
See Also
Other linker:
gi2gl(),
gl2bayesAss(),
gl2bayescan(),
gl2bpp(),
gl2demerelate(),
gl2eigenstrat(),
gl2faststructure(),
gl2gapit(),
gl2genalex(),
gl2genepop(),
gl2geno(),
gl2gi(),
gl2hapmap(),
gl2hiphop(),
gl2related(),
gl2snapper(),
gl2structure(),
gl2treemix(),
gl2vcf()
Examples
require("dartR.data")
if (isTRUE(getOption("dartR_fbm"))) platypus.gl <- gl.gen2fbm(platypus.gl)
gl2gds(platypus.gl,snp.pos='ChromPos_Platypus_Chrom_NCBIv1',
snp.chr = 'Chrom_Platypus_Chrom_NCBIv1', outpath=tempdir())
Converts a genlight object into a format suitable for input to genalex
Description
The output csv file contains the snp data and other relevant lines suitable for genalex. This function is a wrapper for genind2genalex (package poppr).
Usage
gl2genalex(
x,
outfile = "genalex.csv",
outpath = NULL,
overwrite = FALSE,
verbose = NULL
)
Arguments
x |
Name of the genlight object containing SNP data [required]. |
outfile |
Name of the output file (including extension) [default 'genalex.csv']. |
outpath |
Path where to save the output file [default global working directory or if not specified, tempdir()]. |
overwrite |
If FALSE and the file already exists, the call fails with an error and the existing file is left in place; set TRUE to overwrite it [default FALSE]. |
verbose |
Verbosity: 0, silent or fatal errors; 1, begin and end; 2, progress log; 3, progress and results summary; 5, full report [default 2 or as specified using gl.set.verbosity]. |
Value
returns no value (i.e. NULL)
Author(s)
Custodian: Luis Mijangos, Author: Katrin Hohwieler, wrapper Arthur Georges (Post to https://groups.google.com/d/forum/dartr)
References
Peakall, R. and Smouse P.E. (2012) GenAlEx 6.5: genetic analysis in Excel. Population genetic software for teaching and research-an update. Bioinformatics 28, 2537-2539. http://bioinformatics.oxfordjournals.org/content/28/19/2537
See Also
Other linker:
gi2gl(),
gl2bayesAss(),
gl2bayescan(),
gl2bpp(),
gl2demerelate(),
gl2eigenstrat(),
gl2faststructure(),
gl2gapit(),
gl2gds(),
gl2genepop(),
gl2geno(),
gl2gi(),
gl2hapmap(),
gl2hiphop(),
gl2related(),
gl2snapper(),
gl2structure(),
gl2treemix(),
gl2vcf()
Examples
if (isTRUE(getOption("dartR_fbm"))) testset.gl <- gl.gen2fbm(testset.gl)
gl2genalex(testset.gl, outfile='testset.csv', outpath=tempdir())
Converts a genlight object into genepop format (and file)
Description
The genepop format is used by several external applications (for example Neestimator2. Unfortunatelly, the software seems to be no longer easily available. To install use the gl.download.binary function. So the main idea is to create the genepop file and then run the other software externally. As a feature, the genepop file is also returned as an invisible data.frame by the function.
Usage
gl2genepop(
x,
outfile = "genepop.gen",
outpath = NULL,
pop.order = "alphabetic",
output.format = "2_digits",
verbose = NULL
)
Arguments
x |
Name of the genlight object containing the SNP data [required]. |
outfile |
File name of the output file [default 'genepop.gen']. |
outpath |
Path where to save the output file [default global working directory or if not specified, tempdir()]. |
pop.order |
Order of the output populations either "alphabetic" or a vector of population names in the order required by the user (see examples) [default "alphabetic"]. |
output.format |
Whether to use a 2-digit format ("2_digits") or 3-digits format ("3_digits") [default "2_digits"]. |
verbose |
Verbosity: 0, silent or fatal errors; 1, begin and end; 2, progress log; 3, progress and results summary; 5, full report [default NULL, adopting the global verbosity set by gl.set.verbosity(), or 2 if no global is set]. |
Value
Invisible data frame in genepop format
Author(s)
Custodian: Bernd Gruber (Post to https://groups.google.com/d/forum/dartr)
See Also
Other linker:
gi2gl(),
gl2bayesAss(),
gl2bayescan(),
gl2bpp(),
gl2demerelate(),
gl2eigenstrat(),
gl2faststructure(),
gl2gapit(),
gl2gds(),
gl2genalex(),
gl2geno(),
gl2gi(),
gl2hapmap(),
gl2hiphop(),
gl2related(),
gl2snapper(),
gl2structure(),
gl2treemix(),
gl2vcf()
Examples
require("dartR.data")
# SNP data
if (isTRUE(getOption("dartR_fbm"))) possums.gl <- gl.gen2fbm(possums.gl)
geno <- gl2genepop(possums.gl[1:3,1:9], outpath = tempdir())
head(geno)
if (isTRUE(getOption("dartR_fbm"))) platypus.gl <- gl.gen2fbm(platypus.gl)
test <- gl.filter.callrate(platypus.gl,threshold = 1)
popNames(test)
gl2genepop(test, pop.order = c("TENTERFIELD","SEVERN_ABOVE","SEVERN_BELOW"),
output.format="3_digits", outpath = tempdir())
Converts a genlight object to geno format from package LEA
Description
The function converts a genlight object (SNP or presence/absence i.e. SilicoDArT data) into a file in the 'geno' and the 'lfmm' formats from (package LEA).
Usage
gl2geno(x, outfile = "gl_geno", outpath = NULL, verbose = NULL)
Arguments
x |
Name of the genlight object containing the SNP or presence/absence (SilicoDArT) data [required]. |
outfile |
File name of the output file [default 'gl_geno']. |
outpath |
Path where to save the output file [default global working directory or if not specified, tempdir()]. |
verbose |
Verbosity: 0, silent or fatal errors; 1, begin and end; 2, progress log; 3, progress and results summary; 5, full report [default NULL, adopting the global verbosity set by gl.set.verbosity(), or 2 if no global is set]. |
Details
Loci scored as missing (NA) across all individuals are removed before writing, with a warning at verbose >= 1. Missing data are coded 9 in both output files.
Value
returns no value (i.e. NULL)
Author(s)
Author(s): Luis Mijangos. Custodian: Luis Mijangos – Post to https://groups.google.com/d/forum/dartr
See Also
Other linker:
gi2gl(),
gl2bayesAss(),
gl2bayescan(),
gl2bpp(),
gl2demerelate(),
gl2eigenstrat(),
gl2faststructure(),
gl2gapit(),
gl2gds(),
gl2genalex(),
gl2genepop(),
gl2gi(),
gl2hapmap(),
gl2hiphop(),
gl2related(),
gl2snapper(),
gl2structure(),
gl2treemix(),
gl2vcf()
Examples
# SNP data
gl2geno(testset.gl, outpath=tempdir())
# Tag P/A data
gl2geno(testset.gs, outpath=tempdir())
Converts a genlight object to genind object
Description
Converts a genlight object containing SNP data into a genind object (package adegenet), retaining individual names, populations and locus metadata.
Usage
gl2gi(x, probar = FALSE, verbose = NULL)
Arguments
x |
A genlight object [required]. |
probar |
If TRUE, a progress bar is displayed for long loops [default FALSE]. Retained for backward compatibility; the vectorised conversion completes without one. |
verbose |
Verbosity: 0, silent or fatal errors; 1, begin and end; 2, progress log; 3, progress and results summary; 5, full report [default NULL, adopting the global verbosity set by gl.set.verbosity(), or 2 if no global is set]. |
Details
This function uses a faster version of df2genind (from the adegenet package).
Loci scored as missing (NA) across all individuals are removed before
conversion, with a warning at verbose >= 1 – df2genind would remove
them silently, leaving the locus metadata out of register with the
genotypes. When the genlight object carries no allele definitions
(loc.all is NULL), placeholder alleles are fabricated (A/T for
each locus, C/G for the first) and a warning is issued at
verbose >= 1; the fabricated labels are placeholders, not sequence
data.
Value
A genind object, with all slots filled.
Author(s)
Author(s): Bernd Gruber. Custodian: Bernd Gruber – Post to https://groups.google.com/d/forum/dartr
See Also
Other linker:
gi2gl(),
gl2bayesAss(),
gl2bayescan(),
gl2bpp(),
gl2demerelate(),
gl2eigenstrat(),
gl2faststructure(),
gl2gapit(),
gl2gds(),
gl2genalex(),
gl2genepop(),
gl2geno(),
gl2hapmap(),
gl2hiphop(),
gl2related(),
gl2snapper(),
gl2structure(),
gl2treemix(),
gl2vcf()
Examples
if (isTRUE(getOption("dartR_fbm"))) possums.gl <- gl.gen2fbm(possums.gl)
gl2gi(possums.gl[1:10,1:20])
Converts a genlight object into HapMap format
Description
Convert a genlight object into HapMap format, producing a file with
the standard columns for SNP marker ID, chromosome, position, allele
definitions and per-sample genotype calls encoded as nucleotide pairs.
The chromosome information for unmapped SNPs is coded as 0, and the position of SNPs without chromosome-scale position information is likewise coded as 0.
Usage
gl2hapmap(
x,
outfile = "gl_hapmap",
outpath = NULL,
chrom = NULL,
pos = NULL,
strand = "+",
assembly = "",
center = NA,
protLSID = NA,
assayLSID = NA,
panelLSID = NA,
QCcode = NA,
verbose = NULL
)
Arguments
x |
Name of the genlight object containing the SNP data [required]. |
outfile |
File name of the output file [default 'gl_hapmap']. |
outpath |
Path where to save the output file [default global working directory or if not specified, tempdir()]. |
chrom |
Field name from the slot loc.metrics where the chromosome of each SNP is stored; if supplied, this field takes precedence over the chromosome slot [default NULL]. |
pos |
Field name from the slot loc.metrics where the SNP position is stored; if supplied, this field takes precedence over the position slot [default NULL]. |
strand |
Orientation of the SNP in the DNA strand. Thus, SNPs could be in the forward (+) or in the reverse (-) orientation relative to the reference genome [default "+"]. |
assembly |
Version of reference sequence assembly (from NCBI) [default ""]. |
center |
Name of genotyping center that produced the genotypes [default NA]. |
protLSID |
Identifier for HapMap protocol [default NA]. |
assayLSID |
Identifier HapMap assay used for genotyping [default NA]. |
panelLSID |
Identifier for panel of individuals genotyped [default NA]. |
QCcode |
Quality control for all entries [default NA]. |
verbose |
Verbosity: 0, silent or fatal errors; 1, begin and end; 2, progress log; 3, progress and results summary; 5, full report [default 2, unless specified using gl.set.verbosity]. |
Value
returns no value (i.e. NULL)
Author(s)
Custodian: Luis Mijangos (Post to https://groups.google.com/d/forum/dartr)
See Also
Other linker:
gi2gl(),
gl2bayesAss(),
gl2bayescan(),
gl2bpp(),
gl2demerelate(),
gl2eigenstrat(),
gl2faststructure(),
gl2gapit(),
gl2gds(),
gl2genalex(),
gl2genepop(),
gl2geno(),
gl2gi(),
gl2hiphop(),
gl2related(),
gl2snapper(),
gl2structure(),
gl2treemix(),
gl2vcf()
Examples
require("dartR.data")
# SNP data
if (isTRUE(getOption("dartR_fbm"))) platypus.gl <- gl.gen2fbm(platypus.gl)
gl2hapmap(platypus.gl, outpath = tempdir())
Converts a genlight objects into hiphop format
Description
This function exports genlight objects to the format used by the parentage assignment R package hiphop. Hiphop can be used for paternity and maternity assignment and outperforms conventional methods where closely related individuals occur in the pool of possible parents. The method compares the genotypes of offspring with any combination of potentials parents and scores the number of mismatches of these individuals at bi-allelic genetic markers (e.g. Single Nucleotide Polymorphisms).
Usage
gl2hiphop(x, verbose = NULL)
Arguments
x |
Name of the genlight object containing the SNP data [required]. |
verbose |
Verbosity: 0, silent or fatal errors; 1, begin and end; 2, progress log; 3, progress and results summary; 5, full report [default 2 or as specified using gl.set.verbosity]. |
Details
The dartR and hiphop genotype encodings differ: dartR scores 0 = homozygous reference, 1 = heterozygous, 2 = homozygous alternate, while hiphop expects 0 = homozygote, 1 = the other homozygote, 2 = heterozygote. The conversion therefore maps 0 -> 0, 1 -> 2, 2 -> 1, and missing values (NA) are preserved.
Value
Dataframe containing all the genotyped individuals (offspring and potential parents) and their genotypes scored using bi-allelic markers.
Author(s)
Author(s): Luis Mijangos. Custodian: Luis Mijangos – Post to https://groups.google.com/d/forum/dartr
References
Cockburn, A., Penalba, J.V.,Jaccoud, D.,Kilian, A., Brouwer, L.,Double, M.C., Margraf, N., Osmond, H.L., van de Pol, M. and Kruuk, L.E.B.(in revision). HIPHOP: improved paternity assignment among close relatives using a simple exclusion method for bi-allelic markers. Molecular Ecology Resources, DOI to be added upon acceptance
See Also
Other linker:
gi2gl(),
gl2bayesAss(),
gl2bayescan(),
gl2bpp(),
gl2demerelate(),
gl2eigenstrat(),
gl2faststructure(),
gl2gapit(),
gl2gds(),
gl2genalex(),
gl2genepop(),
gl2geno(),
gl2gi(),
gl2hapmap(),
gl2related(),
gl2snapper(),
gl2structure(),
gl2treemix(),
gl2vcf()
Examples
if (isTRUE(getOption("dartR_fbm"))) testset.gl <- gl.gen2fbm(testset.gl)
result <- gl2hiphop(testset.gl)
Converts a genlight object to nexus format for parsimony phylogeny analysis in PAUP and, optionally produces accompanying files for parallel processing
Description
The output nexus file contains the SilicoDArT data as a single line per individual wrapped in the appropriate nexus commands. Pop Labels are used to define taxon partitions.
If out.type="bash", the function produces a series of files in support of an analysis taking advantage of multi-threading and parallel processing.
Usage
gl2paup.parsimony(
x,
outfileprefix = "parsimony",
outpath = NULL,
out.type = "standard",
tip.labels = "ind",
nreps = 100,
nbootstraps = 1000,
ncpus = 1,
mem = 4,
server = "gadi",
base.dir.name = NULL,
pbs.project = "xl04",
test = FALSE,
verbose = NULL
)
Arguments
x |
Name of the genlight object containing the SilicoDArT data [required]. |
outfileprefix |
A prefix to use for file names of the output files [default 'parsimony']. |
outpath |
Path where to save the output file [default global working directory or if not specified, tempdir()]. |
out.type |
Specify the type of output file. Can be 'standard' (consensus tree) or 'newick' (newick) or 'bash' [default 'standard'] |
tip.labels |
Specify whether the terminals should be labelled with the individual labels ('ind'), the population labels ('pop') or both ('indpop') [default 'ind'] |
nreps |
Specify the number of replicate analyses to run in search of the shortest tree [default 100] |
nbootstraps |
Number of bootstrap replicates [default 1000] |
ncpus |
Number of cores to use for parallel processing [default 1] |
mem |
Memory to use for each process [default 4Gb per core] |
server |
If out.type='bash', provide the name of the linux server [default 'gadi'] |
base.dir.name |
Name of the base directory on the server to act as the workspace [default NULL] |
pbs.project |
NCI project code for the #PBS -P directive and the storage directive of the generated job scripts [default 'xl04'] |
test |
If TRUE, the analysis will run with a small subset of the data [default FALSE] |
verbose |
Verbosity: 0, silent or fatal errors; 1, begin and end; 2, progress log; 3, progress and results summary; 5, full report [default NULL, adopting the global verbosity set by gl.set.verbosity(), or 2 if no global is set]. |
Details
Additional details: This script only applies to SilicoDArT data. The output file is the name of the file PAUP will use to deliver the results of the analysis, in the directory specified by outpath.
The output type (out.type) can be 'standard' which uses default PAUP parameters to construct the boot.tre file. Or it can be 'newick' to add the parameter format=newick whereby the boot.tre file contains the final tree in newick format. This is useful for passing the results to a tree graphics program such as Mega 11 to format the tree for publication. Or it can be 'bash' which creates a number of files to facilitate parallel processing on a supercomputer.
The parameter nreps specifies the number of replicates to run in search of the shortest tree in each bootstrap iteration. The default is 100.
The parameter nbootstraps specifies tne number of bootstrap replicates to run to generate a measure of node support. The default is 1000. The companion parameter ncpus specifies how many cpus to use for parallel processing when out.type='bash'. The default is 1. Note that the number of cpus must divide evenly into the number of bootstrap replicates.
The parameter tip.labels specifies whether the terminals in the tree should be labelled with the individual names, or the population names (multiple tips will have the same label – which can cause problems at the point of generating a consensus tree), or a combination of the two. Including the population name in the terminal tip labels will assist in collapsing the tree to have populations as the terminals after checking fidelity of populations to supported clades. This can be done in Mega 11.
The parameter 'server' is to allow for future development as users modify the bash scripts to suit other multitasking environments. This script works only for the Gadi server on the Australian National Computing Infrastructure (NCI).
The parameter pbs.project specifies the NCI project code used for the #PBS -P directive in the generated PBS job scripts, and the first gdata project listed in the #PBS -l storage directive (gdata/if89 is always appended, as the PAUP module and binary reside there). If base.dir.name lies under a different /g/data project, that project is added to the storage directive as well. All generated scripts (out.type='bash') are written to outpath alongside the nexus file.
If test=TRUE, the data will be subsetted heavily on numbers of loci, numbers individuals, bootstrap replicates and number of replicates for branch swapping. This is used to test the job run without expenditure of the resources required for the full job.
Value
returns no value (i.e. NULL)
Author(s)
Author(s): Arthur Georges. Custodian: Arthur Georges – Post to https://groups.google.com/d/forum/dartr
See Also
Other linkers:
gl2paup.svdquartets(),
gl2phylip(),
gl2plink()
Examples
if (isTRUE(getOption("dartR_fbm"))) testset.gl <- gl.gen2fbm(testset.gl)
gg <- testset.gs[1:20,1:100]
gg@other$loc.metrics <- gg@other$loc.metrics[1:100,]
gl2paup.parsimony(gg,outfileprefix="test",outpath=tempdir(),nreps=1,nbootstraps=10)
gl2paup.parsimony(gg,outfileprefix="test",out.type="newick",outpath=tempdir(),
nreps=1,nbootstraps=10)
Converts a genlight object to nexus format PAUP SVDquartets
Description
The output nexus file contains the SNP data in one of two forms, depending upon what you regard as most appropriate. One form, that used by Chifman and Kubatko, has two lines per individual, one providing the reference SNP the second providing the alternate SNP (method=1). A second form, recommended by Dave Swofford, has a single line per individual, resolving heterozygous SNPs by replacing them with standard ambiguity codes (method=2). If the data are tag presence/absence, then method=2 is assumed and the nexus file is written with datatype = standard (0/1 characters).
Usage
gl2paup.svdquartets(
x,
outfile = "svd.nex",
outpath = NULL,
method = 2,
nbootstraps = 10000,
verbose = NULL
)
Arguments
x |
Name of the genlight object containing the SNP data or tag P/A data [required]. |
outfile |
File name of the output file (including extension) [default 'svd.nex']. The PAUP log and tree file names inside the file's paup block are derived from this name. |
outpath |
Path where to save the output file [default global working directory or if not specified, tempdir()]. |
method |
Method = 1, nexus file with two lines per individual; method = 2, nexus file with one line per individual, ambiguity codes for SNP genotypes, 0 or 1 for presence/absence data [default 2]. |
nbootstraps |
Number of bootstrap replicates [default 10000] |
verbose |
Verbosity: 0, silent or fatal errors; 1, begin and end; 2, progress log; 3, progress and results summary; 5, full report [default NULL, adopting the global verbosity set by gl.set.verbosity(), or 2 if no global is set]. |
Value
returns no value (i.e. NULL)
Author(s)
Author(s): Arthur Georges. Custodian: Arthur Georges – Post to https://groups.google.com/d/forum/dartr
References
Chifman, J. and L. Kubatko. 2014. Quartet inference from SNP data under the coalescent. Bioinformatics 30: 3317-3324
See Also
Other linkers:
gl2paup.parsimony(),
gl2phylip(),
gl2plink()
Examples
if (isTRUE(getOption("dartR_fbm"))) testset.gl <- gl.gen2fbm(testset.gl)
gg <- testset.gl[1:20,1:100]
gg@other$loc.metrics <- gg@other$loc.metrics[1:100,]
gl2paup.svdquartets(gg, outpath=tempdir(),nbootstraps=100)
Creates a Phylip input distance matrix from a genlight (SNP) object
Description
This function calculates and returns a matrix of Euclidean distances between populations and produces an input file for the phylogenetic program Phylip (Joe Felsenstein).
Usage
gl2phylip(
x,
outfile = "phyinput.txt",
outpath = NULL,
bstrap = 1,
verbose = NULL
)
Arguments
x |
Name of the genlight object containing the SNP data [required]. |
outfile |
Name of the file to become the input file for phylip [default "phyinput.txt"]. |
outpath |
Path where to save the output file [default global working directory or if not specified, tempdir()]. |
bstrap |
Number of bootstrap replicates [default 1]. |
verbose |
Verbosity: 0, silent or fatal errors; 1, begin and end; 2, progress log; 3, progress and results summary; 5, full report [default NULL, adopting the global verbosity set by gl.set.verbosity(), or 2 if no global is set]. |
Details
Distances are computed from allele frequencies, locus by population: the mean allele dosage of the scored individuals divided by 2. Missing genotypes are excluded from each frequency; if a population has no scored individuals at a locus, the cell is left NA and the affected distances rest on the remaining loci (a warning is given).
Population names are truncated to the 10-character phylip name field; a warning is given when truncation renders two populations identical.
If bstrap > 1, the loci are resampled with replacement for each bootstrap replicate and the replicate distance matrices are appended to the output file. The returned matrix is always the distance matrix computed from the observed data.
Value
Matrix of Euclidean distances between populations, computed from the observed data.
Author(s)
Author(s): Arthur Georges. Custodian: Arthur Georges – Post to https://groups.google.com/d/forum/dartr
See Also
Other linkers:
gl2paup.parsimony(),
gl2paup.svdquartets(),
gl2plink()
Examples
if (isTRUE(getOption("dartR_fbm"))) testset.gl <- gl.gen2fbm(testset.gl)
result <- gl2phylip(testset.gl, outfile='test.txt', outpath=tempdir(), bstrap=10)
Converts a genlight object into PLINK format
Description
This function exports a genlight object into PLINK format and save it into a file. By default it produces two files: a .ped file (which embeds the six sample columns of the .fam format) and a .map file. With bed.files = TRUE and an external PLINK 1.9 binary, the binary .bed, .bim and .fam files are also produced.
Usage
gl2plink(
x,
plink.bin.path = getwd(),
bed.files = FALSE,
outfile = "gl_plink",
outpath = NULL,
chr.format = "character",
pos.cM = "0",
ID.dad = "0",
ID.mum = "0",
sex.code = "unknown",
phen.value = "0",
verbose = NULL
)
Arguments
x |
Name of the genlight object containing the SNP data [required]. |
plink.bin.path |
Path of PLINK binary file [default getwd()]. |
bed.files |
Whether create PLINK files .bed, .bim and .fam [default FALSE]. |
outfile |
File name of the output file [default 'gl_plink']. |
outpath |
Path where to save the output file [default global working directory or if not specified, tempdir()]. |
chr.format |
Whether chromosome information is stored as 'numeric' or as 'character', see details [default 'character']. |
pos.cM |
A vector, with as many elements as there are loci, containing the SNP position in morgans or centimorgans [default '0']. |
ID.dad |
A vector, with as many elements as there are individuals, containing the ID of the father, '0' if father isn't in dataset [default '0']. |
ID.mum |
A vector, with as many elements as there are individuals, containing the ID of the mother, '0' if mother isn't in dataset [default '0']. |
sex.code |
A vector, with as many elements as there are individuals, containing the sex code ('male', 'female', 'unknown'). Sex information needs just to start with an "F" or "f" for females, with an "M" or "m" for males and with a "U", "u" or being empty if the sex is unknown [default 'unknown']. |
phen.value |
A vector, with as many elements as there are individuals, containing the phenotype value. '1' = control, '2' = case, '0' = unknown [default '0']. |
verbose |
Verbosity: 0, silent or fatal errors; 1, begin and end; 2, progress log; 3, progress and results summary; 5, full report [default NULL, adopting the global verbosity set by gl.set.verbosity(), or 2 if no global is set]. |
Details
To create PLINK files .bed, .bim and .fam (bed.files = TRUE), it is necessary to download the binary file of PLINK 1.9 and provide its path (plink.bin.path). The binary file can be downloaded from: https://www.cog-genomics.org/plink/
After downloading, unzip the file, access the unzipped folder and move the binary file ("plink") to your working directory.
If you are using a Mac, you might need to open the binary first to grant access to the binary.
The chromosome of each SNP can be a character or numeric. The chromosome information for unmapped SNPS is coded as 0.
If the accessors x$chromosome and x$position are unset (NULL), the loci are treated as unmapped: chromosome and base-pair position are written as 0, PLINK's own convention, and a warning is given. Note also that if x$position holds within-tag offsets (as when read directly from a DArT report, values typically < 70) rather than genomic coordinates, those offsets are written to the .map as base-pair positions; assign genomic coordinates before calling if downstream position-aware PLINK operations are intended.
Family ID is taken from x$pop.
Within-family ID (cannot be '0') is taken from indNames(x).
Variant identifier is taken from locNames(x).
SNP position is taken from the accessor x$position.
Chromosome name is taken from the accessor x$chromosome
Note that if names of populations or individuals contain spaces, they are replaced by an underscore "_".
If you like to use chromosome information when converting to plink format and your chromosome names are not from human, you need to change the chromosome names as 'contig1', 'contig2', etc. as described in the section "Nonstandard chromosome IDs" in the following link: https://www.cog-genomics.org/plink/1.9/input
Value
returns no value (i.e. NULL)
Author(s)
Author(s): Luis Mijangos. Custodian: Luis Mijangos – Post to https://groups.google.com/d/forum/dartr
References
Purcell, Shaun, et al. 'PLINK: a tool set for whole-genome association and population-based linkage analyses.' The American journal of human genetics 81.3 (2007): 559-575.
See Also
Other linkers:
gl2paup.parsimony(),
gl2paup.svdquartets(),
gl2phylip()
Examples
require("dartR.data")
if (isTRUE(getOption("dartR_fbm"))) platypus.gl <- gl.gen2fbm(platypus.gl)
test <- platypus.gl
# assigning SNP position
test$position <- test$other$loc.metrics$ChromPos_Platypus_Chrom_NCBIv1
# assigning a dummy name for chromosomes
test$chromosome <- as.factor("1")
gl2plink(test, outpath=tempdir())
Converts a genlight object to format suitable to be run with Coancestry
Description
The output txt file contains the SNP data and an additional column with the names of the individual. The file then can be used and loaded into coancestry or - if installed - run with the related package. Be aware the related package was crashing in previous versions, but in general is using the same code as coancestry and therefore should have identical results. Also running coancestry with thousands of SNPs via the GUI seems to be not reliable and therefore for comparisons between coancestry and related we suggest to use the command line version of coancestry.
Usage
gl2related(
x,
outfile = "related.txt",
outpath = NULL,
save = TRUE,
verbose = NULL
)
Arguments
x |
Name of the genlight object containing the SNP data [required]. |
outfile |
File name of the output file (including extension) [default 'related.txt']. |
outpath |
Path where to save the output file [default global working directory or if not specified, tempdir()]. |
save |
A switch if you want to save the file or not. This might be useful for someone who wants to use the coancestry function to calculate relatedness and not export to coancestry. See the example below [default TRUE]. |
verbose |
Verbosity: 0, silent or fatal errors; 1, begin and end; 2, progress log; 3, progress and results summary; 5, full report [default NULL, adopting the global verbosity set by gl.set.verbosity(), or 2 if no global is set]. |
Details
The exported file (and the returned data frame) codes each locus as two columns, one per allele: the reference allele is written as 1 and the alternate allele as 3, so a heterozygote is 1 3, a homozygous reference is 1 1 and a homozygous alternate is 3 3. Missing genotypes are written as 0 0. The first column holds the individual names. The file is tab-separated with no header and no quoting, as expected by COANCESTRY.
Value
A data.frame that can be used to run with the related package
Author(s)
Author(s): Bernd Gruber. Custodian: Bernd Gruber – Post to https://groups.google.com/d/forum/dartr
References
Jack Pew, Jinliang Wang, Paul Muir and Tim Frasier (2014). related: related: an R package for analyzing pairwise relatedness data based on codominant molecular markers. R package version 0.8/r2. https://R-Forge.R-project.org/projects/related/
See Also
Other linker:
gi2gl(),
gl2bayesAss(),
gl2bayescan(),
gl2bpp(),
gl2demerelate(),
gl2eigenstrat(),
gl2faststructure(),
gl2gapit(),
gl2gds(),
gl2genalex(),
gl2genepop(),
gl2geno(),
gl2gi(),
gl2hapmap(),
gl2hiphop(),
gl2snapper(),
gl2structure(),
gl2treemix(),
gl2vcf()
Examples
if (isTRUE(getOption("dartR_fbm"))) bandicoot.gl <- gl.gen2fbm(bandicoot.gl)
gtd <- gl2related(bandicoot.gl[1:10,1:20], save=FALSE, )
## Not run:
##running with the related package, use
#install.packages('related', repos='http://R-Forge.R-project.org')
library(related)
coan <- coancestry(gtd, wang=1)
head(coan$relatedness)
##check ?coancestry for information how to use the function.
## End(Not run)
Converts a genlight object to nexus format suitable for phylogenetic analysis by Snapper (via BEAUti)
Description
Produces a nexus file contains the SNP calls and relevant PAUP command lines suitable for the software package BEAUti.
Usage
gl2snapper(
x,
outfile = "snapper.nex",
rm.autapomorphies = FALSE,
nloc = NULL,
outpath = NULL,
verbose = NULL
)
Arguments
x |
Name of the genlight object containing the SNP data [required]. |
outfile |
Name of the output file (including extension) [default "snapper.nex"]. |
rm.autapomorphies |
Prune the loci by removing autapomorphies (not phylogenetically informative), that is, SNP polymorphisms limited to only one population [default FALSE]. |
nloc |
Number of loci to subsample to bring down computational time [default NULL] |
outpath |
Path where to save the output file [default global working directory or if not specified, tempdir()]. |
verbose |
Verbosity: 0, silent or fatal errors; 1, begin and end; 2, progress log; 3, progress and results summary; 5, full report [default NULL, adopting the global verbosity set by gl.set.verbosity(), or 2 if no global is set]. |
Details
Snapper is a phylogenetic approach implemented in Beauti/BEAST that can handle larger SNP datasets than can SNAPP. This script produces a nexus file for Beauti which allows options to be set and creates the xml file for BEAST.
Although improved over SNAPP in terms of computational efficiency, Snapper remains constrained by computational times, even when implemented on high performance computers with parallel processing. Computation time of Snapper is not particularly sensitive to the number of individuals in each terminal taxon (= population), but is impacted by the number of populations and the numbers of loci.
Particular attention needs to be directed at amalgamating populations where their joint taxonomic identity is without question and reducing the number of SNP loci by prudent filtering. Removing monomorphic loci, increasing the reliability of loci (read depth, reproducibility), minimizing missing data (call rate), removing multiple SNPs in a single sequence tag (secondaries) are all good options. You may wish also to remove SNP loci that are polymorphic within only a single population (autapomorphies) are all options for reducing the number of loci (rm.autapomorphies=TRUE)
If computational time is still an issue (say requiring one month for a single run), following strategy is recommended. First, subsample the loci to say 100 and test the process to ensure there are no syntax or other issues (nloc=100). You do not want to wait several days or weeks running the full dataset to discover a simple syntax error or incorrectly specified parameter. Second consider running BEAST on a platform that allows multi-threading as this will dramatically reduce compute time. Note that adding threads does not always improve computational time. The optimal number of threads depends on the particular analysis. This means you have to experiment to find out how many threads give the best performance for a computer cycle.
Also, there is an overheads cost in using many threads. Instead, you could run independent snapper analyses and combine resulting log and tree files. For example, if the optimal number of threads is 8 (adding more threads reduces speed), but 8 threads gives marginal improvement over 4 threads, you can run 2 chains with 4 threads each instead and (after getting through burn-in) then combine results and get a better result than running a single chain at 8 threads. A bonus benefit from running multiple chains is that you can verify that the MCMC ends up with the same posterior distribution each time.
If computational time is still an issue, run the analysis on a series of subsamples of loci (say nloc=300) to see if a consistent topology is obtained, then adopt that topology as the final result.
Note that there is a cost to manipulating your data to achieve reasonable computation times. Omission of sequence tags that are invariant during the SNP calling process, removal of monomorphic loci generated during taxon selection, and removing autapomorphic loci will all affect branch lengths, perhaps differentially, and so compromise branch lengths and estimates of divergence times. Fortunately, the topology should be little affected.
Finally, the analysis relies on certain assumptions. First is that the structure is one of a bifurcating tree and not a network. One needs to assign individuals to populations in advance of the analysis, confident that they are discrete entities and free of horizontal transfer. A second assumption is that the loci scored for SNPs are assorting independently. This is probably a reasonable assumption for SNPs derived from sparse representational sampling (e.g. DArT), but if dense SNP arrays are being used, then some form of thinning will be required. Of course, multiple SNPs on a single sequence tag will be linked, so filtering all but one SNP per sequence tag is required (gl.filter.secondaries).
The workflow is
"1" Execute gl2snapper()
"2" Install beast2
"3" Run beauti in the beast2 bin
"4" Set the template to snapper [File | Template | Snapper]
"5" Load the nexus file produced by gl2snapper()
"6" Select and set the parameters you consider appropriate
"7" Save the xml file [File | Save As]
"8" Run beast
"9" Load the xml file and execute
"10" When beast is finished, examine the diagnostics with Tracer
"11" Visualize the resultant trees using DensiTree and FigTree.
If using the command line to run beast, the command is beast -threads myxmlfile. Progress can be monitored with awk (awk '{print $1, $2}' snapper.log |tail). When beast is finished, transfer the log and tree files to a windows platform and use Tracer, DensiTree and FigTree as above.
gl2snapper does not work with SilicoDArT data.
Value
returns no value (i.e. NULL)
Author(s)
Author(s): Arthur Georges. Custodian: Arthur Georges – Post to https://groups.google.com/d/forum/dartr
References
Bryant, D., Bouckaert, R., Felsenstein, J., Rosenberg, N.A. and RoyChoudhury, A. (2012). Inferring species trees directly from biallelic genetic markers: bypassing gene trees in a full coalescent analysis. Molecular Biology and Evolution 29:1917-1932.
Rambaut A, Drummond AJ, Xie D, Baele G and Suchard MA (2018) Posterior summarisation in Bayesian phylogenetics using Tracer 1.7. Systematic Biology. syy032. doi:10.1093/sysbio/syy032
See Also
Other linker:
gi2gl(),
gl2bayesAss(),
gl2bayescan(),
gl2bpp(),
gl2demerelate(),
gl2eigenstrat(),
gl2faststructure(),
gl2gapit(),
gl2gds(),
gl2genalex(),
gl2genepop(),
gl2geno(),
gl2gi(),
gl2hapmap(),
gl2hiphop(),
gl2related(),
gl2structure(),
gl2treemix(),
gl2vcf()
Examples
if (isTRUE(getOption("dartR_fbm"))) testset.gl <- gl.gen2fbm(testset.gl)
x <- gl.filter.monomorphs(testset.gl)
gl2snapper(x, outfile="test.nex", outpath=tempdir())
Converts a genlight object to STRUCTURE formatted files
Description
This function exports genlight objects to STRUCTURE formatted files (be aware there is a gl2faststructure version as well). It is based on the code provided by Lindsay Clark (see https://github.com/lvclark/R_genetics_conv) and this function is basically a wrapper around her numeric2structure function. See also: Lindsay Clark. (2017, August 22). lvclark/R_genetics_conv: R_genetics_conv 1.1 (Version v1.1). Zenodo: doi.org/10.5281/zenodo.846816.
Usage
gl2structure(
x,
ind.names = NULL,
add.columns = NULL,
ploidy = 2,
export.marker.names = TRUE,
outfile = "gl.str",
outpath = NULL,
verbose = NULL
)
Arguments
x |
Name of the genlight object containing the SNP data [required]. |
ind.names |
Specify individuals names to be added [if NULL, defaults to indNames(x)]. |
add.columns |
Additional columns to be added before genotypes [default NULL]. |
ploidy |
Set the ploidy [defaults 2]. |
export.marker.names |
If TRUE, locus names locNames(x) will be included [default TRUE]. |
outfile |
File name of the output file (including extension) [default "gl.str"]. |
outpath |
Path where to save the output file [default global working directory or if not specified, tempdir()]. |
verbose |
Verbosity: 0, silent or fatal errors; 1, begin and end; 2, progress log; 3, progress and results summary; 5, full report [default NULL, adopting the global verbosity set by gl.set.verbosity(), or 2 if no global is set]. |
Details
Each individual is written as ploidy rows (two for diploid data), with genotypes coded as allele pairs (0 -> 1/1, 1 -> 1/2, 2 -> 2/2) and missing data as -9. If export.marker.names is TRUE, a header row of locus names precedes the data.
Value
returns no value (i.e. NULL)
Author(s)
Author(s): Bernd Gruber (wrapper), Lindsay V. Clark (lvclark@illinois.edu). Custodian: Bernd Gruber – Post to https://groups.google.com/d/forum/dartr
See Also
Other linker:
gi2gl(),
gl2bayesAss(),
gl2bayescan(),
gl2bpp(),
gl2demerelate(),
gl2eigenstrat(),
gl2faststructure(),
gl2gapit(),
gl2gds(),
gl2genalex(),
gl2genepop(),
gl2geno(),
gl2gi(),
gl2hapmap(),
gl2hiphop(),
gl2related(),
gl2snapper(),
gl2treemix(),
gl2vcf()
Examples
if (isTRUE(getOption("dartR_fbm"))) testset.gl <- gl.gen2fbm(testset.gl)
gl2structure(testset.gl[1:10,1:50], outpath=tempdir())
Converts a genlight object to a treemix input file
Description
The output file contains the SNP data in the format expected by treemix – see the treemix manual. The file will be gzipped before in order to be recognised by treemix. Plotting functions provided with treemix will need to be sourced from the treemix download page.
Usage
gl2treemix(x, outfile = "treemix_input.gz", outpath = NULL, verbose = NULL)
Arguments
x |
Name of the genlight object [required]. |
outfile |
File name of the output file (including gz extension) [default 'treemix_input.gz']. |
outpath |
Path where to save the output file [default global working directory or if not specified, tempdir()]. |
verbose |
Verbosity: 0, silent or fatal errors; 1, begin and end; 2, progress log; 3, progress and results summary; 5, full report [default NULL, adopting the global verbosity set by gl.set.verbosity(), or 2 if no global is set]. |
Details
The output file has a header row of population names followed by one row per locus, each cell holding the reference and alternate allele counts for that population as 'ref,alt'.
Value
returns no value (i.e. NULL)
Author(s)
Author(s): Arthur Georges. Custodian: Arthur Georges – Post to https://groups.google.com/d/forum/dartr
References
Pickrell and Pritchard (2012). Inference of population splits and mixtures from genome-wide allele frequency data. PLoS Genetics https://doi.org/10.1371/journal.pgen.1002967
See Also
Other linker:
gi2gl(),
gl2bayesAss(),
gl2bayescan(),
gl2bpp(),
gl2demerelate(),
gl2eigenstrat(),
gl2faststructure(),
gl2gapit(),
gl2gds(),
gl2genalex(),
gl2genepop(),
gl2geno(),
gl2gi(),
gl2hapmap(),
gl2hiphop(),
gl2related(),
gl2snapper(),
gl2structure(),
gl2vcf()
Examples
if (isTRUE(getOption("dartR_fbm"))) testset.gl <- gl.gen2fbm(testset.gl)
gl2treemix(testset.gl, outpath=tempdir())
Converts a genlight object into vcf format
Description
This function exports a genlight object into VCF format and save it into a file.
Usage
gl2vcf(
x,
plink.bin.path = getwd(),
outfile = "gl_vcf",
outpath = NULL,
snp.pos = NULL,
snp.chr = NULL,
chr.format = "character",
pos.cM = "0",
ID.dad = "0",
ID.mum = "0",
sex.code = "unknown",
phen.value = "0",
verbose = NULL
)
Arguments
x |
Name of the genlight object containing the SNP data [required]. |
plink.bin.path |
Path of PLINK binary file [default getwd()]. |
outfile |
File name of the output file [default 'gl_vcf']. |
outpath |
Path where to save the output file [default global working directory or if not specified, tempdir()]. |
snp.pos |
Field name from the slot loc.metrics where the SNP position is stored [default NULL]. |
snp.chr |
Field name from the slot loc.metrics where the chromosome of each is stored [default NULL]. |
chr.format |
Whether chromosome information is stored as 'numeric' or as 'character', see details [default 'character']. |
pos.cM |
A vector, with as many elements as there are loci, containing the SNP position in morgans or centimorgans [default '0']. |
ID.dad |
A vector, with as many elements as there are individuals, containing the ID of the father, '0' if father isn't in dataset [default '0']. |
ID.mum |
A vector, with as many elements as there are individuals, containing the ID of the mother, '0' if mother isn't in dataset [default '0']. |
sex.code |
A vector, with as many elements as there are individuals, containing the sex code ('male', 'female', 'unknown') [default 'unknown']. |
phen.value |
A vector, with as many elements as there are individuals, containing the phenotype value. '1' = control, '2' = case, '0' = unknown [default '0']. |
verbose |
Verbosity: 0, silent or fatal errors; 1, begin and end; 2, progress log; 3, progress and results summary; 5, full report [default NULL, adopting the global verbosity set by gl.set.verbosity(), or 2 if no global is set]. |
Details
This function requires the binary file of PLINK 1.9 to be downloaded and its path provided (plink.bin.path). The binary file can be downloaded from: https://www.cog-genomics.org/plink/
The slots @position and @chromosome hold genome
coordinates. Explicitly supplied snp.pos/snp.chr loc.metrics fields take
precedence over the slots; when neither a valid slot nor a field is
available, CHROM and POS are written as 0 (unmapped).
Family ID is taken from x$pop
Within-family ID (cannot be '0') is taken from indNames(x)
Variant identifier is taken from locNames(x)
Value
returns no value (i.e. NULL)
Author(s)
Author(s): Luis Mijangos. Custodian: Luis Mijangos – Post to https://groups.google.com/d/forum/dartr
References
Danecek, P., Auton, A., Abecasis, G., Albers, C. A., Banks, E., DePristo, M. A., ... & 1000 Genomes Project Analysis Group. (2011). The variant call format and VCFtools. Bioinformatics, 27(15), 2156-2158.
See Also
Other linker:
gi2gl(),
gl2bayesAss(),
gl2bayescan(),
gl2bpp(),
gl2demerelate(),
gl2eigenstrat(),
gl2faststructure(),
gl2gapit(),
gl2gds(),
gl2genalex(),
gl2genepop(),
gl2geno(),
gl2gi(),
gl2hapmap(),
gl2hiphop(),
gl2related(),
gl2snapper(),
gl2structure(),
gl2treemix()
Examples
## Not run:
# this example needs plink installed to work
require("dartR.data")
if (isTRUE(getOption("dartR_fbm"))) platypus.gl <- gl.gen2fbm(platypus.gl)
gl2vcf(platypus.gl,snp.pos='ChromPos_Platypus_Chrom_NCBIv1',
snp.chr = 'Chrom_Platypus_Chrom_NCBIv1')
## End(Not run)
Frequency of the second allele per locus, for dartR and genlight objects
Description
Returns, for each locus, the mean of the second
(alternative) allele, ignoring missing data: with alleleAsUnit = TRUE,
its frequency among the scored allele copies. It replaces
adegenet::glMean so that FBM-backed dartR objects (see
gl.gen2fbm) are handled; other objects are passed to
adegenet::glMean and give identical results.
Usage
glMean(x, alleleAsUnit = TRUE)
Arguments
x |
Name of the dartR or genlight object [required]. |
alleleAsUnit |
If TRUE, the mean is taken over allele copies; if FALSE, over individuals, each genotype divided by the individual's ploidy [default TRUE]. |
Value
A named numeric vector with one value per locus. Loci with no data give NaN.
Author(s)
Author(s): Bernd Gruber. Custodian: Bernd Gruber – Post to https://groups.google.com/d/forum/dartr
Examples
head(glMean(testset.gl))
fbm.gl <- gl.gen2fbm(testset.gl, verbose = 0)
all.equal(glMean(fbm.gl), glMean(testset.gl))
Sum of the second allele per locus, for dartR and genlight objects
Description
Returns, for each locus, the number of copies of the second
(alternative) allele summed over individuals, ignoring missing data. It
replaces adegenet::glSum so that FBM-backed dartR objects (see
gl.gen2fbm) are handled; other objects are passed to
adegenet::glSum and give identical results.
Usage
glSum(x, alleleAsUnit = TRUE, useC = FALSE)
Arguments
x |
Name of the dartR or genlight object [required]. |
alleleAsUnit |
If TRUE, the sum counts alleles; if FALSE, each genotype is first divided by the individual's ploidy, so the sum counts individuals [default TRUE]. |
useC |
Passed through to adegenet::glSum for non-FBM objects [default FALSE]. |
Value
A named numeric vector with one value per locus; integer for alleleAsUnit = TRUE. Loci with no data give 0.
Author(s)
Author(s): Bernd Gruber. Custodian: Bernd Gruber – Post to https://groups.google.com/d/forum/dartr
Examples
head(glSum(testset.gl))
fbm.gl <- gl.gen2fbm(testset.gl, verbose = 0)
identical(glSum(fbm.gl), glSum(testset.gl))
rbind for dartR objects
Description
Combines the individuals of two or more dartR objects that hold the same loci. Loci are matched by name, so the objects may list them in different orders; the result follows the locus order of the first object.
Metadata are carried over: locus metrics come from the first object;
individual metrics are stacked (a column missing from an object is filled
with NA), and so are coordinates in latlon when every object has
them; the locus-metric flags are reset to FALSE, because metrics such as
call rate and allele frequencies no longer describe the combined set of
individuals (use gl.recalc.metrics to recompute them); the call is
added to the history of the first object.
The function stops when the objects hold different loci, code the alleles
of a locus differently (loc.all), or mix SNP (ploidy 2) and
SilicoDArT (ploidy 1) data. To combine a list of objects, use
do.call(rbind, list_of_objects).
Usage
## S3 method for class 'dartR'
rbind(..., backingfile = NULL, code = NULL, chunk = 2048L, quiet = TRUE)
Arguments
... |
dartR objects to combine [required] |
backingfile |
File stem for the backing file of the resulting FBM, or NULL for a temporary file in getOption("FBM.dir") [default NULL] |
code |
code mapping to use for the resulting FBM=CODE_012; if NULL, inherits from the first FBM input |
chunk |
number of columns to process in a block when copying from FBMs |
quiet |
suppress warnings. default: TRUE |
Value
A dartR object
Examples
t1 <- platypus.gl
t2 <- rbind(t1[1:5,],t1[6:10,])
# a list of objects
t3 <- do.call(rbind, list(t1[1:5,], t1[6:10,], t1[11:15,]))
Default theme for dartR plots
Description
This is the theme used as default for dartR plots. This function controls all non-data display elements in the plots.
Usage
theme_dartR(
base_size = 11,
base_family = "",
base_line_size = base_size/22,
base_rect_size = base_size/22
)
Arguments
base_size |
Base font size, in points; all text sizes scale with it [default 11]. |
base_family |
Base font family [default ""]. |
base_line_size |
Base size for line elements [default base_size / 22]. |
base_rect_size |
Base size for rect elements [default base_size / 22]. |
Value
A complete ggplot2 theme, to be added to a ggplot.
Author(s)
Author(s): Bernd Gruber. Custodian: Bernd Gruber – Post to https://groups.google.com/d/forum/dartr
See Also
Other environment:
gl.check.verbosity(),
gl.check.wd(),
gl.print.history(),
gl.recalc.metrics(),
gl.set.verbosity(),
gl.set.wd()
Examples
ggplot(data.frame(dummy=rnorm(1000)),aes(dummy)) +
geom_histogram(binwidth=0.1) + theme_dartR()
A utility script to calculate allelic richness using bootstraping
Description
A utility script to calculate allelic richness using bootstraping
Usage
utils.allelic.richness(df, indices, boot_method = "loc")
Arguments
df |
Matrix of SNP genotypes (0/1/2/NA); for boot_method "loc" the rows are loci and columns individuals, matching boot::boot's row resampling over loci [required]. |
indices |
Row indices supplied by boot::boot for the current bootstrap replicate [required]. |
boot_method |
"loc" to bootstrap over loci (df is transposed back before computation), "ind" to bootstrap over individuals [default "loc"] |
Value
Mean rarefied allelic richness across sites, rarefied to the minimum allele count observed across sites (hypergeometric formula)
Author(s)
Custodian: Luis Mijangos – Post to https://groups.google.com/d/forum/dartr
See Also
Other utilities:
gl.He(),
gl.Ho(),
gl.alf(),
utils.basic.stats(),
utils.check.datatype(),
utils.collapse.matrix(),
utils.dart2genlight(),
utils.dist.binary(),
utils.fbm.amat(),
utils.fbm.blocks(),
utils.fbm.colblocks(),
utils.fbm.colwise(),
utils.fbm.copy(),
utils.fbm.count.mean(),
utils.fbm.decode(),
utils.fbm.grm(),
utils.fbm.has(),
utils.fbm.new(),
utils.fbm.pair.counts(),
utils.fbm.reader(),
utils.fbm.rowwise(),
utils.fbm.tempfile(),
utils.flag.start(),
utils.het.pop(),
utils.history.call(),
utils.is.fixed(),
utils.jackknife(),
utils.n.var.invariant(),
utils.plot.save(),
utils.read.fasta(),
utils.read.ped(),
utils.recalc.avgpic(),
utils.recalc.callrate(),
utils.recalc.freqhets(),
utils.recalc.freqhomref(),
utils.recalc.freqhomsnp(),
utils.recalc.maf(),
utils.reset.flags(),
utils.transpose(),
utils.vcf.depth(),
utils.vcfr2genlight.polyploid()
Calculates mean observed heterozygosity, mean expected heterozygosity and FIS per locus, per population and various population differentiation measures
Description
WARNING: UTILITY SCRIPTS ARE FOR INTERNAL USE ONLY AND SHOULD NOT BE USED BY END USERS AS THEIR USE OUT OF CONTEXT COULD LEAD TO UNPREDICTABLE OUTCOMES.
Usage
utils.basic.stats(x, rounded = TRUE)
Arguments
x |
A genlight object containing the SNP genotypes [required]. SilicoDArT (presence/absence) data are rejected with an error. |
rounded |
If TRUE, results are rounded to 4 decimals; FALSE returns them unrounded [default TRUE]. |
Details
This is a re-implementation of hierfstat::basic.stats specifically
for genlight objects. Formula (and hence results) match exactly the
original version of hierfstat::basic.stats but it is much faster.
Loci absent from one or more populations are computed from the
populations that carry them. With a single population, only Ho, Hs and
Fis are meaningful; the differentiation measures involve divisions by
zero and are not interpretable.
Value
A list with the statistics for each population
Author(s)
Luis Mijangos and Carlo Pacioni (post to https://groups.google.com/d/forum/dartr)
See Also
Other utilities:
gl.He(),
gl.Ho(),
gl.alf(),
utils.allelic.richness(),
utils.check.datatype(),
utils.collapse.matrix(),
utils.dart2genlight(),
utils.dist.binary(),
utils.fbm.amat(),
utils.fbm.blocks(),
utils.fbm.colblocks(),
utils.fbm.colwise(),
utils.fbm.copy(),
utils.fbm.count.mean(),
utils.fbm.decode(),
utils.fbm.grm(),
utils.fbm.has(),
utils.fbm.new(),
utils.fbm.pair.counts(),
utils.fbm.reader(),
utils.fbm.rowwise(),
utils.fbm.tempfile(),
utils.flag.start(),
utils.het.pop(),
utils.history.call(),
utils.is.fixed(),
utils.jackknife(),
utils.n.var.invariant(),
utils.plot.save(),
utils.read.fasta(),
utils.read.ped(),
utils.recalc.avgpic(),
utils.recalc.callrate(),
utils.recalc.freqhets(),
utils.recalc.freqhomref(),
utils.recalc.freqhomsnp(),
utils.recalc.maf(),
utils.reset.flags(),
utils.transpose(),
utils.vcf.depth(),
utils.vcfr2genlight.polyploid()
Examples
require("dartR.data")
if (isTRUE(getOption("dartR_fbm"))) platypus.gl <- gl.gen2fbm(platypus.gl)
out <- utils.basic.stats(platypus.gl)
Utility function to check the class of an object passed to a function
Description
WARNING: UTILITY SCRIPTS ARE FOR INTERNAL USE ONLY AND SHOULD NOT BE USED BY END USERS AS THEIR USE OUT OF CONTEXT COULD LEAD TO UNPREDICTABLE OUTCOMES.
Usage
utils.check.datatype(
x,
accept = c("genlight", "SNP", "SilicoDArT", "dartR"),
verbose = NULL
)
Arguments
x |
Name of the genlight object, dist matrix, data matrix, glPCA, or fixed difference list (fd) [required]. |
accept |
Vector containing the classes of objects that are to be accepted. Matching is exact and case-sensitive. The entries 'genlight' and 'dartR' accept both genotype datatypes ('SNP' and 'SilicoDArT') [default c('genlight','SNP','SilicoDArT','dartR')]. |
verbose |
Verbosity: 0, silent or fatal errors; 1, begin and end; 2, progress log; 3, progress and results summary; 5, full report [default NULL, unless specified using gl.set.verbosity]. |
Details
Most functions require access to a genlight object, dist matrix, data matrix or fixed difference list (fd), and this function checks that a genlight object or one of the above has been passed, whether the genlight object is a SNP dataset or a SilicoDArT object, and reports back if verbosity is >=2.
This function checks the class of passed object and sets the datatype to
'SNP', 'SilicoDArT', 'dist', 'matrix', 'glPca', 'fd', 'data.frame',
'list', or class(x)[1] as appropriate.
A genlight object is classified from its ploidy slot alone (uniformly 1,
'SilicoDArT'; uniformly 2, 'SNP'; mixed or other ploidy is treated as
'SNP', with a warning) – genotype values, dartR flags and locus metrics
are not consulted, with one exception: an object of uniform ploidy 2
whose non-missing genotypes are all 0 or 1, and which carries no SNP
metadata (an empty loc.all slot and no SNP or SnpPosition locus
metrics), is treated as SNP data with a warning (verbose >= 1) that it
may be presence/absence (SilicoDArT) content mislabelled as SNP. Such an
object is ambiguous: a small simulated sample or a hand-built object can
lack the homozygous-alternate class. A clean SNP subset that merely
lacks the homozygous-alternate class and keeps its loc.all slot raises
no warning. Content-level validation beyond that check is the job
of gl.compliance.check.
Note also that this function checks to see if there are individuals or loci
scored as all missing (NA) and if so, issues the user with a warning
(verbose >= 2).
Value
datatype (returned invisibly): 'SNP' for SNP data, 'SilicoDArT' for P/A data, 'dist' for a distance matrix, 'matrix' for a data matrix, 'glPca' for an ordination file, 'fd' for a fixed difference object, 'data.frame' for a data frame, 'list' for any other list, or class(x)[1].
Author(s)
Author(s): Arthur Georges. Custodian: Arthur Georges – Post to https://groups.google.com/d/forum/dartr
See Also
Other utilities:
gl.He(),
gl.Ho(),
gl.alf(),
utils.allelic.richness(),
utils.basic.stats(),
utils.collapse.matrix(),
utils.dart2genlight(),
utils.dist.binary(),
utils.fbm.amat(),
utils.fbm.blocks(),
utils.fbm.colblocks(),
utils.fbm.colwise(),
utils.fbm.copy(),
utils.fbm.count.mean(),
utils.fbm.decode(),
utils.fbm.grm(),
utils.fbm.has(),
utils.fbm.new(),
utils.fbm.pair.counts(),
utils.fbm.reader(),
utils.fbm.rowwise(),
utils.fbm.tempfile(),
utils.flag.start(),
utils.het.pop(),
utils.history.call(),
utils.is.fixed(),
utils.jackknife(),
utils.n.var.invariant(),
utils.plot.save(),
utils.read.fasta(),
utils.read.ped(),
utils.recalc.avgpic(),
utils.recalc.callrate(),
utils.recalc.freqhets(),
utils.recalc.freqhomref(),
utils.recalc.freqhomsnp(),
utils.recalc.maf(),
utils.reset.flags(),
utils.transpose(),
utils.vcf.depth(),
utils.vcfr2genlight.polyploid()
Examples
if (isTRUE(getOption("dartR_fbm"))) testset.gl <- gl.gen2fbm(testset.gl)
datatype <- utils.check.datatype(testset.gl)
datatype <- utils.check.datatype(as.matrix(testset.gl),accept='matrix')
fd <- gl.fixed.diff(testset.gl)
datatype <- utils.check.datatype(fd,accept='fd')
Collapses a distance matrix calculated for individuals to a distance matrix for populations defined in a dartR genlight object
Description
WARNING: UTILITY SCRIPTS ARE FOR INTERNAL USE ONLY AND SHOULD NOT BE USED BY END USERS AS THEIR USE OUT OF CONTEXT COULD LEAD TO UNPREDICTABLE OUTCOMES.
Usage
utils.collapse.matrix(D, x, verbose = NULL)
Arguments
D |
Name of the matrix containing the distances between individuals [required]. |
x |
Name of the genlight object containing the genotypes [required]. |
verbose |
Verbosity: 0, silent or fatal errors; 1, begin and end; 2, progress log; 3, progress and results summary; 5, full report [default 2]. |
Details
This script takes a matrix of distances calculated between individuals and collapses it by averaging to a matrix of distances between populations. The script gl.dist.ind has a lot of options for distances for presence absence data, but gl.dist.pop does not. This script allows efficient and consistent transfer of this capability to gl.dist.pop.
Value
An object of class 'dist' or 'matrix' giving mean distances between populations; the diagonal holds the mean distance among distinct individuals within each population
Author(s)
Author: Arthur Georges. Custodian: Arthur Georges – Post to https://groups.google.com/d/forum/dartr
See Also
Other utilities:
gl.He(),
gl.Ho(),
gl.alf(),
utils.allelic.richness(),
utils.basic.stats(),
utils.check.datatype(),
utils.dart2genlight(),
utils.dist.binary(),
utils.fbm.amat(),
utils.fbm.blocks(),
utils.fbm.colblocks(),
utils.fbm.colwise(),
utils.fbm.copy(),
utils.fbm.count.mean(),
utils.fbm.decode(),
utils.fbm.grm(),
utils.fbm.has(),
utils.fbm.new(),
utils.fbm.pair.counts(),
utils.fbm.reader(),
utils.fbm.rowwise(),
utils.fbm.tempfile(),
utils.flag.start(),
utils.het.pop(),
utils.history.call(),
utils.is.fixed(),
utils.jackknife(),
utils.n.var.invariant(),
utils.plot.save(),
utils.read.fasta(),
utils.read.ped(),
utils.recalc.avgpic(),
utils.recalc.callrate(),
utils.recalc.freqhets(),
utils.recalc.freqhomref(),
utils.recalc.freqhomsnp(),
utils.recalc.maf(),
utils.reset.flags(),
utils.transpose(),
utils.vcf.depth(),
utils.vcfr2genlight.polyploid()
An internal function to converts DarT to genlight.
Description
WARNING: UTILITY SCRIPTS ARE FOR INTERNAL USE ONLY AND SHOULD NOT BE USED BY END USERS AS THEIR USE OUT OF CONTEXT COULD LEAD TO UNPREDICTABLE OUTCOMES.
Usage
utils.dart2genlight(
dart,
ind.metafile = NULL,
covfilename = NULL,
probar = TRUE,
verbose = NULL
)
Arguments
dart |
A dart object created via read.dart [required]. |
ind.metafile |
Optional file in csv format with metadata for each individual (see details for explanation) [default NULL]. |
covfilename |
Depreciated, use parameter ind.metafile. |
probar |
Show progress bar [default TRUE]. |
verbose |
Verbosity: 0, silent or fatal errors; 1, begin and end; 2, progress log; 3, progress and results summary; 5, full report [default NULL]. |
Details
Converts a DArT file (read via read.dart) into an
genlight object from package adegenet. #' Internal function called by gl.read.dart().
The ind.metadata file needs to have very specific headings. First a heading
called id. Here the ids have to match the ids in the dart object
colnames(dart[[4]]). The following column headings are optional.
pop: specifies the population membership of each individual. lat and lon
specify spatial coordinates (in decimal degrees WGS1984 format). Additional
columns with individual metadata can be imported (e.g. age, gender).
Note that the ind.metafile acts as a filter as well as a source of metadata: individuals in the DArT file that have no matching id row in the ind.metafile are REMOVED from the returned object (a warning reports how many were removed).
Value
A genlight object. Including all available slots are filled. loc.names, ind.names, pop, lat, lon (if provided via the ind.metadata file)
Author(s)
Maintainer: Bernd Gruber (Post to https://groups.google.com/d/forum/dartr)
See Also
Other utilities:
gl.He(),
gl.Ho(),
gl.alf(),
utils.allelic.richness(),
utils.basic.stats(),
utils.check.datatype(),
utils.collapse.matrix(),
utils.dist.binary(),
utils.fbm.amat(),
utils.fbm.blocks(),
utils.fbm.colblocks(),
utils.fbm.colwise(),
utils.fbm.copy(),
utils.fbm.count.mean(),
utils.fbm.decode(),
utils.fbm.grm(),
utils.fbm.has(),
utils.fbm.new(),
utils.fbm.pair.counts(),
utils.fbm.reader(),
utils.fbm.rowwise(),
utils.fbm.tempfile(),
utils.flag.start(),
utils.het.pop(),
utils.history.call(),
utils.is.fixed(),
utils.jackknife(),
utils.n.var.invariant(),
utils.plot.save(),
utils.read.fasta(),
utils.read.ped(),
utils.recalc.avgpic(),
utils.recalc.callrate(),
utils.recalc.freqhets(),
utils.recalc.freqhomref(),
utils.recalc.freqhomsnp(),
utils.recalc.maf(),
utils.reset.flags(),
utils.transpose(),
utils.vcf.depth(),
utils.vcfr2genlight.polyploid()
Calculates a distance matrix for individuals defined in a dartR genlight object using binary P/A data (SilicoDArT)
Description
WARNING: UTILITY SCRIPTS ARE FOR INTERNAL USE ONLY AND SHOULD NOT BE USED BY END USERS AS THEIR USE OUT OF CONTEXT COULD LEAD TO UNPREDICTABLE OUTCOMES.
Usage
utils.dist.binary(
x,
method = "simple",
scale = FALSE,
swap = FALSE,
type = "dist",
verbose = NULL
)
Arguments
x |
Name of the genlight containing the genotypes [required]. |
method |
Specify distance measure [default simple]. |
scale |
If TRUE and method='euclidean', the distance will be scaled to fall in the range [0,1] [default FALSE]. |
swap |
If TRUE and working with presence-absence data, then presence (no disrupting mutation) is scored as 0 and absence (presence of a disrupting mutation) is scored as 1 [default FALSE]. |
type |
Specify the format and class of the object to be returned, dist for an object of class dist, matrix for an object of class matrix [default "dist"]. |
verbose |
Verbosity: 0, silent or fatal errors; 1, begin and end; 2, progress log; 3, progress and results summary; 5, full report [default 2]. |
Details
This script calculates various distances between individuals based on sequence tag Presence/Absence data.
The distance measure can be one of:
Euclidean – Euclidean Distance applied to cartesian coordinates defined by the loci, scored as 0 or 1. Presence and absence equally weighted.
simple – simple matching, both 1 or both 0 = 0; one 1 and the other 0 = 1. Presence and absence equally weighted.
Jaccard – ignores matching 0, both 1 = 0; one 1 and the other 0 = 1. Absences could be for different reasons.
Bray-Curtis – both 0 = 0; both 1 = 2; one 1 and the other 0 = 1. Absences could be for different reasons. Sometimes called the Dice or Sorensen distance.
One might choose to disregard or downweight absences in comparison with presences because the homology of absences is less clear (mutation at one or the other, or both restriction sites). Your call.
Value
An object of class 'dist' or 'matrix' giving distances between individuals
Author(s)
Author: Arthur Georges. Custodian: Arthur Georges – Post to https://groups.google.com/d/forum/dartr
See Also
Other utilities:
gl.He(),
gl.Ho(),
gl.alf(),
utils.allelic.richness(),
utils.basic.stats(),
utils.check.datatype(),
utils.collapse.matrix(),
utils.dart2genlight(),
utils.fbm.amat(),
utils.fbm.blocks(),
utils.fbm.colblocks(),
utils.fbm.colwise(),
utils.fbm.copy(),
utils.fbm.count.mean(),
utils.fbm.decode(),
utils.fbm.grm(),
utils.fbm.has(),
utils.fbm.new(),
utils.fbm.pair.counts(),
utils.fbm.reader(),
utils.fbm.rowwise(),
utils.fbm.tempfile(),
utils.flag.start(),
utils.het.pop(),
utils.history.call(),
utils.is.fixed(),
utils.jackknife(),
utils.n.var.invariant(),
utils.plot.save(),
utils.read.fasta(),
utils.read.ped(),
utils.recalc.avgpic(),
utils.recalc.callrate(),
utils.recalc.freqhets(),
utils.recalc.freqhomref(),
utils.recalc.freqhomsnp(),
utils.recalc.maf(),
utils.reset.flags(),
utils.transpose(),
utils.vcf.depth(),
utils.vcfr2genlight.polyploid()
Calculates a distance matrix for individuals defined in a genlight object using SNP data (DArTseq)
Description
WARNING: UTILITY SCRIPTS ARE FOR INTERNAL USE ONLY AND SHOULD NOT BE USED BY END USERS AS THEIR USE OUT OF CONTEXT COULD LEAD TO UNPREDICTABLE OUTCOMES.
Usage
utils.dist.ind.snp(
x,
method = "Euclidean",
scale = FALSE,
type = "dist",
verbose = NULL
)
Arguments
x |
Name of the genlight containing the genotypes [required]. |
method |
Specify distance measure [default Euclidean]. |
scale |
If TRUE and method='Euclidean', the summed squared differences are divided by the number of loci compared, so the distance falls in the range [0,2] for SNP genotypes scored 0, 1 or 2 [default FALSE]. |
type |
Specify the format and class of the object to be returned, dist for a object of class dist, matrix for an object of class matrix [default "dist"]. |
verbose |
Verbosity: 0, silent or fatal errors; 1, begin and end; 2, progress log; 3, progress and results summary; 5, full report [default 2]. |
Details
This script calculates various distances between individuals based on SNP genotypes.
The distance measure can be one of:
Euclidean – Euclidean Distance applied to Cartesian coordinates defined by the loci, scored as 0, 1 or 2.
Simple – based on shared alleles per locus: 0 where no alleles are shared, 1 where one allele is shared, 2 where both alleles are shared; distance = 1 - mean(shared)/2. With biallelic SNPs this is arithmetically identical to the Czekanowski distance.
Absolute – 0 where no alleles are shared (opposite homozygotes), 1 where one or both alleles are shared; distance is the proportion of loci with no shared alleles.
Czekanowski (or Manhattan) calculates the city block metric distance by summing the scores on each axis (locus).
All measures are invariant to which allele is scored as the reference allele.
Value
An object of class 'dist' or 'matrix' giving distances between individuals
Author(s)
Author(s): Arthur Georges. Custodian: Arthur Georges – Post to https://groups.google.com/d/forum/dartr
See Also
Other distance:
gl.dist.ind(),
gl.dist.pop(),
gl.fst.pop(),
gl.propShared()
Additive relationship matrix by rrBLUP::A.mat for gen- and file-backed objects
Description
WARNING: UTILITY SCRIPTS ARE FOR INTERNAL USE ONLY AND SHOULD NOT BE USED BY END USERS AS THEIR USE OUT OF CONTEXT COULD LEAD TO UNPREDICTABLE OUTCOMES.
Computes rrBLUP::A.mat(as.matrix(x) - 1, ...), the matrix used by
gl.grm (dartR.captive) and gl.grm2 (dartR.spatial):
gen-backed object: rrBLUP::A.mat, unchanged;
file-backed object with A.mat's default method (mean imputation, no shrinkage, no imputed matrix returned;
min.MAF,max.missing,n.coreandtolmay be given):utils.fbm.grm, in blocks of loci without decoding the genotype matrix (agrees with A.mat to about 1e-13);file-backed object with any other A.mat option (
shrink,impute.method = "EM",return.imputed): these need the whole matrix, so the object is converted to a genlight (gl.fbm2gen) with a warning that states the memory A.mat will use, and A.mat is run (it stops instead if that exceeds the limit ofutils.fbm.decode).
Usage
utils.fbm.amat(x, dots = list(), verbose = 2)
Arguments
x |
A dartR object (diploid SNP) [required]. |
dots |
A named list of arguments for rrBLUP::A.mat [default list()]. |
verbose |
Verbosity of the warning about converting [default 2]. |
Value
The matrix returned by rrBLUP::A.mat (or a list, with
return.imputed = TRUE).
Author(s)
Custodian: Bernd Gruber – Post to https://groups.google.com/d/forum/dartr
See Also
Other utilities:
gl.He(),
gl.Ho(),
gl.alf(),
utils.allelic.richness(),
utils.basic.stats(),
utils.check.datatype(),
utils.collapse.matrix(),
utils.dart2genlight(),
utils.dist.binary(),
utils.fbm.blocks(),
utils.fbm.colblocks(),
utils.fbm.colwise(),
utils.fbm.copy(),
utils.fbm.count.mean(),
utils.fbm.decode(),
utils.fbm.grm(),
utils.fbm.has(),
utils.fbm.new(),
utils.fbm.pair.counts(),
utils.fbm.reader(),
utils.fbm.rowwise(),
utils.fbm.tempfile(),
utils.flag.start(),
utils.het.pop(),
utils.history.call(),
utils.is.fixed(),
utils.jackknife(),
utils.n.var.invariant(),
utils.plot.save(),
utils.read.fasta(),
utils.read.ped(),
utils.recalc.avgpic(),
utils.recalc.callrate(),
utils.recalc.freqhets(),
utils.recalc.freqhomref(),
utils.recalc.freqhomsnp(),
utils.recalc.maf(),
utils.reset.flags(),
utils.transpose(),
utils.vcf.depth(),
utils.vcfr2genlight.polyploid()
Blocks of loci for reading a dartR object
Description
WARNING: UTILITY SCRIPTS ARE FOR INTERNAL USE ONLY AND SHOULD NOT BE USED BY END USERS AS THEIR USE OUT OF CONTEXT COULD LEAD TO UNPREDICTABLE OUTCOMES.
A list of consecutive locus indices covering all loci, each block sized
by options(bigstatsr.block.sizeGB) for nr rows (the block
size dartR uses for file-backed objects).
Usage
utils.fbm.blocks(x, nr = nInd(x))
Arguments
x |
A dartR object [required]. |
nr |
Number of rows read per block [default nInd(x)]. |
Value
A list of integer vectors.
Author(s)
Custodian: Bernd Gruber – Post to https://groups.google.com/d/forum/dartr
See Also
Other utilities:
gl.He(),
gl.Ho(),
gl.alf(),
utils.allelic.richness(),
utils.basic.stats(),
utils.check.datatype(),
utils.collapse.matrix(),
utils.dart2genlight(),
utils.dist.binary(),
utils.fbm.amat(),
utils.fbm.colblocks(),
utils.fbm.colwise(),
utils.fbm.copy(),
utils.fbm.count.mean(),
utils.fbm.decode(),
utils.fbm.grm(),
utils.fbm.has(),
utils.fbm.new(),
utils.fbm.pair.counts(),
utils.fbm.reader(),
utils.fbm.rowwise(),
utils.fbm.tempfile(),
utils.flag.start(),
utils.het.pop(),
utils.history.call(),
utils.is.fixed(),
utils.jackknife(),
utils.n.var.invariant(),
utils.plot.save(),
utils.read.fasta(),
utils.read.ped(),
utils.recalc.avgpic(),
utils.recalc.callrate(),
utils.recalc.freqhets(),
utils.recalc.freqhomref(),
utils.recalc.freqhomsnp(),
utils.recalc.maf(),
utils.reset.flags(),
utils.transpose(),
utils.vcf.depth(),
utils.vcfr2genlight.polyploid()
Applies a function to blocks of loci and returns the per-block results
Description
WARNING: UTILITY SCRIPTS ARE FOR INTERNAL USE ONLY AND SHOULD NOT BE USED BY END USERS AS THEIR USE OUT OF CONTEXT COULD LEAD TO UNPREDICTABLE OUTCOMES.
As utils.fbm.colwise, but returns the list of per-block
results, for callers that combine them themselves (e.g. FUN returns a
list, or counts to be added). For a gen-backed object, a list with the
single result FUN(as.matrix(x)[rows, ]).
Usage
utils.fbm.colblocks(x, FUN, rows = NULL)
Arguments
x |
A dartR object [required]. |
FUN |
Function of a genotype matrix (individuals x loci) [required]. |
rows |
Row indices, or NULL for all individuals [default NULL]. |
Value
A list of per-block results, in locus order.
Author(s)
Custodian: Bernd Gruber – Post to https://groups.google.com/d/forum/dartr
See Also
Other utilities:
gl.He(),
gl.Ho(),
gl.alf(),
utils.allelic.richness(),
utils.basic.stats(),
utils.check.datatype(),
utils.collapse.matrix(),
utils.dart2genlight(),
utils.dist.binary(),
utils.fbm.amat(),
utils.fbm.blocks(),
utils.fbm.colwise(),
utils.fbm.copy(),
utils.fbm.count.mean(),
utils.fbm.decode(),
utils.fbm.grm(),
utils.fbm.has(),
utils.fbm.new(),
utils.fbm.pair.counts(),
utils.fbm.reader(),
utils.fbm.rowwise(),
utils.fbm.tempfile(),
utils.flag.start(),
utils.het.pop(),
utils.history.call(),
utils.is.fixed(),
utils.jackknife(),
utils.n.var.invariant(),
utils.plot.save(),
utils.read.fasta(),
utils.read.ped(),
utils.recalc.avgpic(),
utils.recalc.callrate(),
utils.recalc.freqhets(),
utils.recalc.freqhomref(),
utils.recalc.freqhomsnp(),
utils.recalc.maf(),
utils.reset.flags(),
utils.transpose(),
utils.vcf.depth(),
utils.vcfr2genlight.polyploid()
Applies a per-locus statistic in blocks of loci
Description
WARNING: UTILITY SCRIPTS ARE FOR INTERNAL USE ONLY AND SHOULD NOT BE USED BY END USERS AS THEIR USE OUT OF CONTEXT COULD LEAD TO UNPREDICTABLE OUTCOMES.
Returns the same value as FUN(as.matrix(x)[rows, ]), where FUN
computes one value per locus (e.g. colMeans(m, na.rm = TRUE)). A
file-backed object is read in blocks of loci (size set by
options(bigstatsr.block.sizeGB)) and the results are concatenated,
so the whole genotype matrix is never decoded; blocks are decoded exactly
as by as.matrix() (integer storage, indNames/locNames as dimnames),
so the values are identical. A gen-backed object is decoded once. FUN may
return a matrix with one column per locus; the blocks are then bound with
cbind().
Usage
utils.fbm.colwise(x, FUN, rows = NULL)
Arguments
x |
A dartR object [required]. |
FUN |
Function of a genotype matrix (individuals x loci) returning one value (or one column) per locus [required]. |
rows |
Row indices (e.g. the individuals of one population), or NULL for all individuals [default NULL]. |
Value
A vector with one value per locus, or a matrix with one column per locus.
Author(s)
Custodian: Bernd Gruber – Post to https://groups.google.com/d/forum/dartr
See Also
Other utilities:
gl.He(),
gl.Ho(),
gl.alf(),
utils.allelic.richness(),
utils.basic.stats(),
utils.check.datatype(),
utils.collapse.matrix(),
utils.dart2genlight(),
utils.dist.binary(),
utils.fbm.amat(),
utils.fbm.blocks(),
utils.fbm.colblocks(),
utils.fbm.copy(),
utils.fbm.count.mean(),
utils.fbm.decode(),
utils.fbm.grm(),
utils.fbm.has(),
utils.fbm.new(),
utils.fbm.pair.counts(),
utils.fbm.reader(),
utils.fbm.rowwise(),
utils.fbm.tempfile(),
utils.flag.start(),
utils.het.pop(),
utils.history.call(),
utils.is.fixed(),
utils.jackknife(),
utils.n.var.invariant(),
utils.plot.save(),
utils.read.fasta(),
utils.read.ped(),
utils.recalc.avgpic(),
utils.recalc.callrate(),
utils.recalc.freqhets(),
utils.recalc.freqhomref(),
utils.recalc.freqhomsnp(),
utils.recalc.maf(),
utils.reset.flags(),
utils.transpose(),
utils.vcf.depth(),
utils.vcfr2genlight.polyploid()
Copies (part of) an FBM.code256 into a temporary backing file
Description
WARNING: UTILITY SCRIPTS ARE FOR INTERNAL USE ONLY AND SHOULD NOT BE USED BY END USERS AS THEIR USE OUT OF CONTEXT COULD LEAD TO UNPREDICTABLE OUTCOMES.
A wrapper of bigstatsr::big_copy() whose backing file is placed by
utils.fbm.tempfile and recorded as created by dartR.
Usage
utils.fbm.copy(
G,
ind.row = bigstatsr::rows_along(G),
ind.col = bigstatsr::cols_along(G),
prefix = "geno_"
)
Arguments
G |
An FBM.code256 [required]. |
ind.row |
Rows to copy [default all]. |
ind.col |
Columns to copy [default all]. |
prefix |
Start of the temporary file name [default "geno_"]. |
Value
An FBM.code256 with the same code mapping.
Author(s)
Custodian: Bernd Gruber – Post to https://groups.google.com/d/forum/dartr
See Also
Other utilities:
gl.He(),
gl.Ho(),
gl.alf(),
utils.allelic.richness(),
utils.basic.stats(),
utils.check.datatype(),
utils.collapse.matrix(),
utils.dart2genlight(),
utils.dist.binary(),
utils.fbm.amat(),
utils.fbm.blocks(),
utils.fbm.colblocks(),
utils.fbm.colwise(),
utils.fbm.count.mean(),
utils.fbm.decode(),
utils.fbm.grm(),
utils.fbm.has(),
utils.fbm.new(),
utils.fbm.pair.counts(),
utils.fbm.reader(),
utils.fbm.rowwise(),
utils.fbm.tempfile(),
utils.flag.start(),
utils.het.pop(),
utils.history.call(),
utils.is.fixed(),
utils.jackknife(),
utils.n.var.invariant(),
utils.plot.save(),
utils.read.fasta(),
utils.read.ped(),
utils.recalc.avgpic(),
utils.recalc.callrate(),
utils.recalc.freqhets(),
utils.recalc.freqhomref(),
utils.recalc.freqhomsnp(),
utils.recalc.maf(),
utils.reset.flags(),
utils.transpose(),
utils.vcf.depth(),
utils.vcfr2genlight.polyploid()
Means of counts, formed exactly as rowMeans() forms them
Description
WARNING: UTILITY SCRIPTS ARE FOR INTERNAL USE ONLY AND SHOULD NOT BE USED BY END USERS AS THEIR USE OUT OF CONTEXT COULD LEAD TO UNPREDICTABLE OUTCOMES.
R's mean() of a logical vector, rowMeans() and
colMeans() divide a long-double sum by the count. For counts added
over blocks of loci, a plain num / den differs from that in the
last digit for about one count in 6,000 once den exceeds 2,048.
This returns, element by element, exactly the value mean() gives
for num TRUE among den values, so statistics counted in
blocks stay identical to those of the decoded matrix.
Usage
utils.fbm.count.mean(num, den)
Arguments
num |
Numerators: whole numbers (e.g. heterozygous loci per individual) [required]. |
den |
Denominators: whole numbers, recycled to the length of num (e.g. called loci per individual) [required]. |
Value
A numeric vector with the names of num; NaN where den is 0.
Author(s)
Custodian: Bernd Gruber – Post to https://groups.google.com/d/forum/dartr
See Also
Other utilities:
gl.He(),
gl.Ho(),
gl.alf(),
utils.allelic.richness(),
utils.basic.stats(),
utils.check.datatype(),
utils.collapse.matrix(),
utils.dart2genlight(),
utils.dist.binary(),
utils.fbm.amat(),
utils.fbm.blocks(),
utils.fbm.colblocks(),
utils.fbm.colwise(),
utils.fbm.copy(),
utils.fbm.decode(),
utils.fbm.grm(),
utils.fbm.has(),
utils.fbm.new(),
utils.fbm.pair.counts(),
utils.fbm.reader(),
utils.fbm.rowwise(),
utils.fbm.tempfile(),
utils.flag.start(),
utils.het.pop(),
utils.history.call(),
utils.is.fixed(),
utils.jackknife(),
utils.n.var.invariant(),
utils.plot.save(),
utils.read.fasta(),
utils.read.ped(),
utils.recalc.avgpic(),
utils.recalc.callrate(),
utils.recalc.freqhets(),
utils.recalc.freqhomref(),
utils.recalc.freqhomsnp(),
utils.recalc.maf(),
utils.reset.flags(),
utils.transpose(),
utils.vcf.depth(),
utils.vcfr2genlight.polyploid()
Decodes the whole genotype matrix, with a memory guard for file-backed objects
Description
WARNING: UTILITY SCRIPTS ARE FOR INTERNAL USE ONLY AND SHOULD NOT BE USED BY END USERS AS THEIR USE OUT OF CONTEXT COULD LEAD TO UNPREDICTABLE OUTCOMES.
For functions whose algorithm needs the whole genotype matrix in memory.
Returns as.matrix(x). For a gen-backed object nothing else
happens. For a file-backed object the memory the matrix needs is
estimated first (nInd(x) * nLoc(x) * bytes): it is reported at
verbose >= 2, and if it exceeds
getOption("dartR_fbm_max_decode_gb", 4) Gb the function stops
with an informative error instead of exhausting memory. The limit can
be raised, e.g. options(dartR_fbm_max_decode_gb = 16).
Usage
utils.fbm.decode(x, what = "this function", bytes = 8, copies = 1, verbose = 2)
Arguments
x |
A dartR object [required]. |
what |
Name of the calling function, for the messages [default "this function"]. |
bytes |
Bytes per genotype of the matrix the caller works with (4 for integers, 8 for doubles) [default 8]. |
copies |
Number of such matrices the caller holds at once [default 1]. |
verbose |
Verbosity [default 2]. |
Value
The decoded genotype matrix, as as.matrix(x).
Author(s)
Custodian: Bernd Gruber – Post to https://groups.google.com/d/forum/dartr
See Also
Other utilities:
gl.He(),
gl.Ho(),
gl.alf(),
utils.allelic.richness(),
utils.basic.stats(),
utils.check.datatype(),
utils.collapse.matrix(),
utils.dart2genlight(),
utils.dist.binary(),
utils.fbm.amat(),
utils.fbm.blocks(),
utils.fbm.colblocks(),
utils.fbm.colwise(),
utils.fbm.copy(),
utils.fbm.count.mean(),
utils.fbm.grm(),
utils.fbm.has(),
utils.fbm.new(),
utils.fbm.pair.counts(),
utils.fbm.reader(),
utils.fbm.rowwise(),
utils.fbm.tempfile(),
utils.flag.start(),
utils.het.pop(),
utils.history.call(),
utils.is.fixed(),
utils.jackknife(),
utils.n.var.invariant(),
utils.plot.save(),
utils.read.fasta(),
utils.read.ped(),
utils.recalc.avgpic(),
utils.recalc.callrate(),
utils.recalc.freqhets(),
utils.recalc.freqhomref(),
utils.recalc.freqhomsnp(),
utils.recalc.maf(),
utils.reset.flags(),
utils.transpose(),
utils.vcf.depth(),
utils.vcfr2genlight.polyploid()
Additive relationship matrix of a file-backed object, as rrBLUP::A.mat with its default settings, in blocks of loci
Description
WARNING: UTILITY SCRIPTS ARE FOR INTERNAL USE ONLY AND SHOULD NOT BE USED BY END USERS AS THEIR USE OUT OF CONTEXT COULD LEAD TO UNPREDICTABLE OUTCOMES.
Computes the realized additive relationship matrix of
rrBLUP::A.mat(as.matrix(x) - 1, min.MAF, max.missing) with A.mat's
default mean imputation and no shrinkage (Endelman & Jannink 2012;
VanRaden 2008), reading the genotypes in two passes over blocks of loci,
so the genotype matrix is never decoded as a whole.
As in A.mat, with genotypes g (0, 1, 2) and X = g - 1: per locus
the frequency p is mean(g, na.rm = TRUE) / 2 (computed per column
exactly as A.mat computes it) and the missing fraction is the share of
NA. Loci with min(p, 1 - p) >= min.MAF and missing fraction
<= max.missing are used (m loci). W = g - 2p, with missing
genotypes set to 0 (mean imputation) and loci fixed in the sample set to
0, and A = tcrossprod(W) / (2 * mean(p * (1 - p))) / m, where the
mean is over the m loci.
The frequencies, filter and scaling are identical to A.mat; the cross-product is added block by block, so A agrees with A.mat to about 1e-13 (relative) rather than bit for bit. Memory: the n x n result and one block of loci.
Usage
utils.fbm.grm(x, min.MAF = NULL, max.missing = NULL)
Arguments
x |
A file-backed dartR object (diploid SNP) [required]. |
min.MAF |
Minimum minor allele frequency [default 1/(2n), as A.mat]. |
max.missing |
Maximum missing fraction of a locus [default 1 - 1/(2n), as A.mat]. |
Value
An n x n matrix with indNames(x) as row and column names.
Author(s)
Custodian: Bernd Gruber – Post to https://groups.google.com/d/forum/dartr
References
Endelman, J.B. and Jannink, J.-L. (2012) Shrinkage estimation of the realized relationship matrix. G3 2:1405-1413.
See Also
Other utilities:
gl.He(),
gl.Ho(),
gl.alf(),
utils.allelic.richness(),
utils.basic.stats(),
utils.check.datatype(),
utils.collapse.matrix(),
utils.dart2genlight(),
utils.dist.binary(),
utils.fbm.amat(),
utils.fbm.blocks(),
utils.fbm.colblocks(),
utils.fbm.colwise(),
utils.fbm.copy(),
utils.fbm.count.mean(),
utils.fbm.decode(),
utils.fbm.has(),
utils.fbm.new(),
utils.fbm.pair.counts(),
utils.fbm.reader(),
utils.fbm.rowwise(),
utils.fbm.tempfile(),
utils.flag.start(),
utils.het.pop(),
utils.history.call(),
utils.is.fixed(),
utils.jackknife(),
utils.n.var.invariant(),
utils.plot.save(),
utils.read.fasta(),
utils.read.ped(),
utils.recalc.avgpic(),
utils.recalc.callrate(),
utils.recalc.freqhets(),
utils.recalc.freqhomref(),
utils.recalc.freqhomsnp(),
utils.recalc.maf(),
utils.reset.flags(),
utils.transpose(),
utils.vcf.depth(),
utils.vcfr2genlight.polyploid()
Tests whether a dartR object holds its genotypes in a file-backed matrix
Description
WARNING: UTILITY SCRIPTS ARE FOR INTERNAL USE ONLY AND SHOULD NOT BE USED BY END USERS AS THEIR USE OUT OF CONTEXT COULD LEAD TO UNPREDICTABLE OUTCOMES.
TRUE if x has an fbm slot holding a
bigstatsr::FBM.code256, FALSE for a gen-backed object (also for a
plain adegenet genlight, which has no such slot).
Usage
utils.fbm.has(x)
Arguments
x |
A genlight or dartR object [required]. |
Value
TRUE or FALSE.
Author(s)
Custodian: Bernd Gruber – Post to https://groups.google.com/d/forum/dartr
See Also
Other utilities:
gl.He(),
gl.Ho(),
gl.alf(),
utils.allelic.richness(),
utils.basic.stats(),
utils.check.datatype(),
utils.collapse.matrix(),
utils.dart2genlight(),
utils.dist.binary(),
utils.fbm.amat(),
utils.fbm.blocks(),
utils.fbm.colblocks(),
utils.fbm.colwise(),
utils.fbm.copy(),
utils.fbm.count.mean(),
utils.fbm.decode(),
utils.fbm.grm(),
utils.fbm.new(),
utils.fbm.pair.counts(),
utils.fbm.reader(),
utils.fbm.rowwise(),
utils.fbm.tempfile(),
utils.flag.start(),
utils.het.pop(),
utils.history.call(),
utils.is.fixed(),
utils.jackknife(),
utils.n.var.invariant(),
utils.plot.save(),
utils.read.fasta(),
utils.read.ped(),
utils.recalc.avgpic(),
utils.recalc.callrate(),
utils.recalc.freqhets(),
utils.recalc.freqhomref(),
utils.recalc.freqhomsnp(),
utils.recalc.maf(),
utils.reset.flags(),
utils.transpose(),
utils.vcf.depth(),
utils.vcfr2genlight.polyploid()
Creates an FBM.code256 for genotypes in a temporary backing file
Description
WARNING: UTILITY SCRIPTS ARE FOR INTERNAL USE ONLY AND SHOULD NOT BE USED BY END USERS AS THEIR USE OUT OF CONTEXT COULD LEAD TO UNPREDICTABLE OUTCOMES.
Creates a new bigstatsr::FBM.code256. With backingfile =
NULL the file is placed by utils.fbm.tempfile and recorded
as created by dartR; a backing file named by the caller is used as given
and not recorded.
Usage
utils.fbm.new(
n,
p,
code = bigsnpr::CODE_012,
backingfile = NULL,
prefix = "geno_"
)
Arguments
n |
Number of individuals (rows) [required]. |
p |
Number of loci (columns) [required]. |
code |
Code mapping of the FBM [default bigsnpr::CODE_012]. |
backingfile |
File stem of the backing file, or NULL for a temporary file [default NULL]. |
prefix |
Start of the temporary file name [default "geno_"]. |
Value
An FBM.code256.
Author(s)
Custodian: Bernd Gruber – Post to https://groups.google.com/d/forum/dartr
See Also
Other utilities:
gl.He(),
gl.Ho(),
gl.alf(),
utils.allelic.richness(),
utils.basic.stats(),
utils.check.datatype(),
utils.collapse.matrix(),
utils.dart2genlight(),
utils.dist.binary(),
utils.fbm.amat(),
utils.fbm.blocks(),
utils.fbm.colblocks(),
utils.fbm.colwise(),
utils.fbm.copy(),
utils.fbm.count.mean(),
utils.fbm.decode(),
utils.fbm.grm(),
utils.fbm.has(),
utils.fbm.pair.counts(),
utils.fbm.reader(),
utils.fbm.rowwise(),
utils.fbm.tempfile(),
utils.flag.start(),
utils.het.pop(),
utils.history.call(),
utils.is.fixed(),
utils.jackknife(),
utils.n.var.invariant(),
utils.plot.save(),
utils.read.fasta(),
utils.read.ped(),
utils.recalc.avgpic(),
utils.recalc.callrate(),
utils.recalc.freqhets(),
utils.recalc.freqhomref(),
utils.recalc.freqhomsnp(),
utils.recalc.maf(),
utils.reset.flags(),
utils.transpose(),
utils.vcf.depth(),
utils.vcfr2genlight.polyploid()
Pairwise genotype comparisons of all individuals of a file-backed object
Description
WARNING: UTILITY SCRIPTS ARE FOR INTERNAL USE ONLY AND SHOULD NOT BE USED BY END USERS AS THEIR USE OUT OF CONTEXT COULD LEAD TO UNPREDICTABLE OUTCOMES.
For each pair of individuals, the number of loci scored in both
(L) and, among those, the numbers that differ by one (n1)
and by two allele copies (n2), counted over blocks of loci read
from the backing file (compiled with Rcpp at the first call). Genotypes
must be coded 0, 1, 2 or NA (diploid). The counts are whole numbers, so
they do not depend on the block size; distances built from them are
identical to those computed from the decoded matrix. Only for file-backed
objects; a gen-backed object gives an error.
Usage
utils.fbm.pair.counts(x)
Arguments
x |
A file-backed dartR object [required]. |
Value
A list of three integer vectors L, n1, n2,
each in the order of a dist object (lower triangle by columns) of
length n(n - 1)/2 (12 bytes per pair).
Author(s)
Custodian: Bernd Gruber – Post to https://groups.google.com/d/forum/dartr
See Also
Other utilities:
gl.He(),
gl.Ho(),
gl.alf(),
utils.allelic.richness(),
utils.basic.stats(),
utils.check.datatype(),
utils.collapse.matrix(),
utils.dart2genlight(),
utils.dist.binary(),
utils.fbm.amat(),
utils.fbm.blocks(),
utils.fbm.colblocks(),
utils.fbm.colwise(),
utils.fbm.copy(),
utils.fbm.count.mean(),
utils.fbm.decode(),
utils.fbm.grm(),
utils.fbm.has(),
utils.fbm.new(),
utils.fbm.reader(),
utils.fbm.rowwise(),
utils.fbm.tempfile(),
utils.flag.start(),
utils.het.pop(),
utils.history.call(),
utils.is.fixed(),
utils.jackknife(),
utils.n.var.invariant(),
utils.plot.save(),
utils.read.fasta(),
utils.read.ped(),
utils.recalc.avgpic(),
utils.recalc.callrate(),
utils.recalc.freqhets(),
utils.recalc.freqhomref(),
utils.recalc.freqhomsnp(),
utils.recalc.maf(),
utils.reset.flags(),
utils.transpose(),
utils.vcf.depth(),
utils.vcfr2genlight.polyploid()
Reader of parts of the decoded genotype matrix
Description
WARNING: UTILITY SCRIPTS ARE FOR INTERNAL USE ONLY AND SHOULD NOT BE USED BY END USERS AS THEIR USE OUT OF CONTEXT COULD LEAD TO UNPREDICTABLE OUTCOMES.
Returns a function function(rows = NULL, cols = NULL) giving
as.matrix(x)[rows, cols, drop = FALSE] (NULL: all rows or all
columns), with the dimnames and storage of as.matrix(). For a
file-backed object only the requested part is read from the backing
file; reading one individual touches the whole file (it is stored by
loci), so read few rows. For a gen-backed object the matrix is decoded
once and kept by the reader. Blocks of loci for a loop over the reader
come from utils.fbm.blocks.
Usage
utils.fbm.reader(x)
Arguments
x |
A dartR object [required]. |
Value
A function of rows and cols.
Author(s)
Custodian: Bernd Gruber – Post to https://groups.google.com/d/forum/dartr
See Also
Other utilities:
gl.He(),
gl.Ho(),
gl.alf(),
utils.allelic.richness(),
utils.basic.stats(),
utils.check.datatype(),
utils.collapse.matrix(),
utils.dart2genlight(),
utils.dist.binary(),
utils.fbm.amat(),
utils.fbm.blocks(),
utils.fbm.colblocks(),
utils.fbm.colwise(),
utils.fbm.copy(),
utils.fbm.count.mean(),
utils.fbm.decode(),
utils.fbm.grm(),
utils.fbm.has(),
utils.fbm.new(),
utils.fbm.pair.counts(),
utils.fbm.rowwise(),
utils.fbm.tempfile(),
utils.flag.start(),
utils.het.pop(),
utils.history.call(),
utils.is.fixed(),
utils.jackknife(),
utils.n.var.invariant(),
utils.plot.save(),
utils.read.fasta(),
utils.read.ped(),
utils.recalc.avgpic(),
utils.recalc.callrate(),
utils.recalc.freqhets(),
utils.recalc.freqhomref(),
utils.recalc.freqhomsnp(),
utils.recalc.maf(),
utils.reset.flags(),
utils.transpose(),
utils.vcf.depth(),
utils.vcfr2genlight.polyploid()
Adds a per-individual sum over loci in blocks of loci
Description
WARNING: UTILITY SCRIPTS ARE FOR INTERNAL USE ONLY AND SHOULD NOT BE USED BY END USERS AS THEIR USE OUT OF CONTEXT COULD LEAD TO UNPREDICTABLE OUTCOMES.
Returns the same value as FUN(as.matrix(x)), where FUN is a sum
over loci per individual (e.g. rowSums(is.na(m))); FUN may return
a matrix with one row per individual (several sums). A file-backed object
is read in blocks of loci and the per-block results are added; sums of
counts are exact in double precision, so the values are identical. Only
for sums: for means of counts use utils.fbm.count.mean on
the summed counts.
Usage
utils.fbm.rowwise(x, FUN)
Arguments
x |
A dartR object [required]. |
FUN |
Function of a genotype matrix returning per-individual sums [required]. |
Value
A vector (or matrix) with one value (row) per individual.
Author(s)
Custodian: Bernd Gruber – Post to https://groups.google.com/d/forum/dartr
See Also
Other utilities:
gl.He(),
gl.Ho(),
gl.alf(),
utils.allelic.richness(),
utils.basic.stats(),
utils.check.datatype(),
utils.collapse.matrix(),
utils.dart2genlight(),
utils.dist.binary(),
utils.fbm.amat(),
utils.fbm.blocks(),
utils.fbm.colblocks(),
utils.fbm.colwise(),
utils.fbm.copy(),
utils.fbm.count.mean(),
utils.fbm.decode(),
utils.fbm.grm(),
utils.fbm.has(),
utils.fbm.new(),
utils.fbm.pair.counts(),
utils.fbm.reader(),
utils.fbm.tempfile(),
utils.flag.start(),
utils.het.pop(),
utils.history.call(),
utils.is.fixed(),
utils.jackknife(),
utils.n.var.invariant(),
utils.plot.save(),
utils.read.fasta(),
utils.read.ped(),
utils.recalc.avgpic(),
utils.recalc.callrate(),
utils.recalc.freqhets(),
utils.recalc.freqhomref(),
utils.recalc.freqhomsnp(),
utils.recalc.maf(),
utils.reset.flags(),
utils.transpose(),
utils.vcf.depth(),
utils.vcfr2genlight.polyploid()
File stem for a new temporary FBM backing file
Description
WARNING: UTILITY SCRIPTS ARE FOR INTERNAL USE ONLY AND SHOULD NOT BE USED BY END USERS AS THEIR USE OUT OF CONTEXT COULD LEAD TO UNPREDICTABLE OUTCOMES.
Returns a file stem (without the .bk extension) in the folder given by
getOption("FBM.dir"), the option bigstatsr uses for its own backing
files, or in tempdir() if the option is not set. The folder is
created if it does not exist. To keep file-backed genotypes on another
disk, set e.g. options(FBM.dir = "D:/scratch").
Usage
utils.fbm.tempfile(prefix = "geno_")
Arguments
prefix |
Start of the file name [default "geno_"]. |
Value
A file stem.
Author(s)
Custodian: Bernd Gruber – Post to https://groups.google.com/d/forum/dartr
See Also
Other utilities:
gl.He(),
gl.Ho(),
gl.alf(),
utils.allelic.richness(),
utils.basic.stats(),
utils.check.datatype(),
utils.collapse.matrix(),
utils.dart2genlight(),
utils.dist.binary(),
utils.fbm.amat(),
utils.fbm.blocks(),
utils.fbm.colblocks(),
utils.fbm.colwise(),
utils.fbm.copy(),
utils.fbm.count.mean(),
utils.fbm.decode(),
utils.fbm.grm(),
utils.fbm.has(),
utils.fbm.new(),
utils.fbm.pair.counts(),
utils.fbm.reader(),
utils.fbm.rowwise(),
utils.flag.start(),
utils.het.pop(),
utils.history.call(),
utils.is.fixed(),
utils.jackknife(),
utils.n.var.invariant(),
utils.plot.save(),
utils.read.fasta(),
utils.read.ped(),
utils.recalc.avgpic(),
utils.recalc.callrate(),
utils.recalc.freqhets(),
utils.recalc.freqhomref(),
utils.recalc.freqhomsnp(),
utils.recalc.maf(),
utils.reset.flags(),
utils.transpose(),
utils.vcf.depth(),
utils.vcfr2genlight.polyploid()
A utility script to flag the start of a script
Description
WARNING: UTILITY SCRIPTS ARE FOR INTERNAL USE ONLY AND SHOULD NOT BE USED BY END USERS AS THEIR USE OUT OF CONTEXT COULD LEAD TO UNPREDICTABLE OUTCOMES.
Usage
utils.flag.start(func = NULL, build = NULL, verbose = NULL)
Arguments
func |
Name of the function that is starting [required]. |
build |
Name of the build [default NULL]. |
verbose |
Verbosity: 0, silent or fatal errors; 1, begin and end; 2, progress log; 3, progress and results summary; 5, full report [default 2 or as specified using gl.set.verbosity] |
Value
The calling function name, invisibly
Author(s)
Custodian: Arthur Georges – Post to https://groups.google.com/d/forum/dartr
See Also
Other utilities:
gl.He(),
gl.Ho(),
gl.alf(),
utils.allelic.richness(),
utils.basic.stats(),
utils.check.datatype(),
utils.collapse.matrix(),
utils.dart2genlight(),
utils.dist.binary(),
utils.fbm.amat(),
utils.fbm.blocks(),
utils.fbm.colblocks(),
utils.fbm.colwise(),
utils.fbm.copy(),
utils.fbm.count.mean(),
utils.fbm.decode(),
utils.fbm.grm(),
utils.fbm.has(),
utils.fbm.new(),
utils.fbm.pair.counts(),
utils.fbm.reader(),
utils.fbm.rowwise(),
utils.fbm.tempfile(),
utils.het.pop(),
utils.history.call(),
utils.is.fixed(),
utils.jackknife(),
utils.n.var.invariant(),
utils.plot.save(),
utils.read.fasta(),
utils.read.ped(),
utils.recalc.avgpic(),
utils.recalc.callrate(),
utils.recalc.freqhets(),
utils.recalc.freqhomref(),
utils.recalc.freqhomsnp(),
utils.recalc.maf(),
utils.reset.flags(),
utils.transpose(),
utils.vcf.depth(),
utils.vcfr2genlight.polyploid()
Compiled Hamming comparison engine shared by gl.filter.hamming and gl.report.hamming
Description
WARNING: UTILITY SCRIPTS ARE FOR INTERNAL USE ONLY AND SHOULD NOT BE USED BY END USERS AS THEIR USE OUT OF CONTEXT COULD LEAD TO UNPREDICTABLE OUTCOMES.
Usage
.hamming_engine_cache
Format
An object of class environment of length 0.
Details
Compiles (on first call in a session) and returns two Rcpp functions:
-
dedup: the block-hashing near-duplicate detector used bygl.filter.hamming. Given a list of equal-length raw vectors ordered from worst to best call rate and a mismatch thresholdk, it returns a logical keep vector whereFALSEmarks a locus with a kept partner withinkmismatches, plus a flag indicating whether the candidate cap was hit. -
pairwise: exact Hamming mismatch counts for a given matrix of index pairs, used bygl.report.hammingfor the distance distribution.
The compiled functions are cached in a package-local environment, so the
C++ toolchain runs at most once per session. Requires the package
Rcpp and a working compiler toolchain; callers must guard with
requireNamespace("Rcpp").
Value
A list with elements dedup and pairwise.
Author(s)
Custodian: Luis Mijangos – Post to https://groups.google.com/d/forum/dartr
Validates arguments and prepares trimmed sequences for gl.filter.hamming and gl.report.hamming
Description
WARNING: UTILITY SCRIPTS ARE FOR INTERNAL USE ONLY AND SHOULD NOT BE USED BY END USERS AS THEIR USE OUT OF CONTEXT COULD LEAD TO UNPREDICTABLE OUTCOMES.
Usage
utils.hamming.prepare(x, threshold, rs, min.length)
Arguments
x |
Name of the genlight object [required]. |
threshold |
Maximum number of mismatching bases [required]. |
rs |
Number of bases to skip from the start of the TrimmedSequence [required]. |
min.length |
Length of the compared substring [required]. |
Details
Holds the one copy of the argument checks and sequence preparation shared
by gl.filter.hamming and gl.report.hamming. The report
simulates the filter exactly only if both prepare the sequences in the
same way, so neither function repeats this code.
Each TrimmedSequence is upper-cased, the first rs bases are
skipped and the next min.length bases are kept. Loci whose
substring is exactly min.length bases long are comparable; they are
ordered from most to least missing data, so that the compiled engine,
which keeps the later of two duplicates, always keeps the locus with the
better call rate.
Value
A list with elements raws (raw vectors, one per locus),
idx (indices of comparable loci), ord (idx ordered
from worst to best call rate) and n.short (number of loci that are
not comparable).
Author(s)
Author(s): Luis Mijangos. Custodian: Luis Mijangos – Post to https://groups.google.com/d/forum/dartr
Enhanced Heat Map
Description
A heat map is a false‐color image with optional row/column dendrograms and extensive customization of scaling, coloring, labeling, and layout.
Usage
utils.heatmap(
x,
Rowv = TRUE,
Colv = if (symm) "Rowv" else TRUE,
distfun = dist,
hclustfun = hclust,
dendrogram = c("both", "row", "column", "none"),
reorderfun = function(d, w) reorder(d, w),
symm = FALSE,
scale = c("none", "row", "column"),
na.rm = TRUE,
revC = identical(Colv, "Rowv"),
add.expr,
breaks,
symbreaks = any(x < 0, na.rm = TRUE) || scale != "none",
col = "heat.colors",
colsep,
rowsep,
sepcolor = "white",
sepwidth = c(0.05, 0.05),
cellnote,
notecex = 1,
notecol = "cyan",
na.color = par("bg"),
trace = c("column", "row", "both", "none"),
tracecol = "cyan",
hline = median(breaks),
vline = median(breaks),
linecol = tracecol,
margins = c(5, 5),
ColSideColors = NULL,
RowSideColors = NULL,
cexRow = 0.2 + 1/log10(nr),
cexCol = 0.2 + 1/log10(nc),
labRow = NULL,
labCol = NULL,
srtRow = NULL,
srtCol = NULL,
adjRow = c(0, NA),
adjCol = c(NA, 0),
offsetRow = 0.5,
offsetCol = 0.5,
colRow = NULL,
colCol = NULL,
key = TRUE,
keysize = 1.5,
density.info = c("histogram", "density", "none"),
denscol = tracecol,
symkey = any(x < 0, na.rm = TRUE) || symbreaks,
densadj = 0.25,
key.title = NULL,
key.xlab = NULL,
key.ylab = NULL,
key.xtickfun = NULL,
key.ytickfun = NULL,
key.par = list(),
main = NULL,
xlab = NULL,
ylab = NULL,
lmat = NULL,
lhei = NULL,
lwid = NULL,
extrafun = NULL,
...
)
Arguments
x |
Numeric matrix of the values to be plotted. |
Rowv |
Logical, dendrogram, or vector. Controls row‐dendrogram creation and/or reordering. |
Colv |
Logical, dendrogram, or vector. Controls column‐dendrogram creation and/or reordering; may be "Rowv" for square matrices. |
distfun |
Function to compute distances; defaults to |
hclustfun |
Function to cluster; defaults to |
dendrogram |
Which dendrogram(s) to draw: "both", "row", "column", or "none". |
reorderfun |
Function to reorder dendrogram given weights. |
symm |
Logical; treat |
scale |
Character: "none", "row", or "column" scaling of |
na.rm |
Logical; remove |
revC |
Logical; reverse column order for plotting. |
add.expr |
Expression to evaluate after the heat map image is drawn. |
breaks |
Numeric vector or integer: breakpoints for color bins. |
symbreaks |
Logical; force symmetric breaks around zero. |
col |
Color palette or function; defaults to |
colsep, rowsep |
Integer vectors; where to put separator lines between blocks. |
sepcolor |
Color for separators. |
sepwidth |
Numeric vector of length 2; widths of separators relative to cell size. |
cellnote |
Optional character matrix for annotating each cell. |
notecex |
Numeric; scaling for |
notecol |
Color for |
na.color |
Color for |
trace |
Character: "column", "row", "both", or "none" for trace lines. |
tracecol |
Color for trace lines. |
hline, vline |
Numeric vectors; values at which to draw horizontal/vertical lines. |
linecol |
Color for |
margins |
Numeric vector of length 2; margins for column and row labels. |
ColSideColors, RowSideColors |
Optional color vectors for side bars [default NULL]. |
cexRow, cexCol |
Numeric; character expansion for row/column labels. |
labRow, labCol |
Character vectors of labels; defaults to row/column names. |
srtRow, srtCol |
Rotation angles for row/column labels. |
adjRow, adjCol |
Justification for row/column labels. |
offsetRow, offsetCol |
Numeric offsets (in character widths) for labels. |
colRow, colCol |
Color(s) for row/column label text. |
key |
Logical; draw a color key. |
keysize |
Numeric; size of the color key. |
density.info |
Character: "histogram", "density", or "none" on the key. |
denscol |
Color for density plot. |
symkey |
Logical; symmetric key around zero. |
densadj |
Numeric; adjustment for density bandwidth. |
key.title, key.xlab, key.ylab |
Main title and axis labels for key. |
key.xtickfun, key.ytickfun |
Functions for tick placement on key axes. |
key.par |
List of graphical parameters for the key. |
main, xlab, ylab |
Main title and axis labels for the heat map. |
lmat |
Matrix specifying layout positions. |
lhei |
Numeric vector specifying row heights in layout. |
lwid |
Numeric vector specifying column widths in layout. |
extrafun |
Function to call after plotting (e.g. add scatterplot). |
... |
Additional arguments passed to |
Details
This function is a modified copy of gplots::heatmap.2,
vendored so that dendrogram leaf labels can be drawn and colored
(via dendextend, arguments colRow/colCol) - the
original suppresses them. Other local modifications: dendrogram
margins auto-sized from the column names,
ColSideColors/RowSideColors default to NULL, and a
local invalid2() replaces gplots' unexported helper.
If Rowv or Colv are dendrograms, they are honored
without reordering; otherwise they are computed via
as.dendrogram(hclustfun(distfun(...))) and optionally reordered.
Scaling centers and scales rows or columns when requested. The
default color palette may be enhanced via packages such as
RColorBrewer. Layout may be customized with
lmat, lwid, and lhei as in layout.
Value
Invisibly, a list with components:
- rowInd
Row permutation vector.
- colInd
Column permutation vector.
- call
Matched function call.
- rowMeans,rowSDs
Row means and SDs (if
scale="row").- colMeans,colSDs
Column means and SDs (if
scale="column").- carpet
Reordered/scaled matrix used for the image.
- rowDendrogram,colDendrogram
Dendrogram objects.
- breaks
Breakpoints used for colors.
- col
Colors used.
- vline,hline
Center‐line values for trace (if used).
- colorTable
Data frame of color bins and ranges.
- layout
List with
lmat,lhei,lwid.
Note
The original rows and columns are reordered to match the dendrograms.
Because heatmap.2 uses layout, it cannot be used
inside another layout (e.g. par(mfrow=...)).
Author(s)
Andy Liaw (original); R. Gentleman, M. Maechler, W. Huber, G. Warnes (revisions)
Examples
data(mtcars)
x <- as.matrix(mtcars)
utils.heatmap(x)
utils.heatmap(x, dendrogram = "none")
utils.heatmap(x, scale = "row", col = cm.colors(255))
An internal function that calculates expected mean heterozygosity per population
Description
WARNING: UTILITY SCRIPTS ARE FOR INTERNAL USE ONLY AND SHOULD NOT BE USED BY END USERS AS THEIR USE OUT OF CONTEXT COULD LEAD TO UNPREDICTABLE OUTCOMES.
Usage
ind.count(x)
Arguments
x |
A genlight object containing the SNP genotypes [required]. |
Details
For each population the unbiased expected heterozygosity 2n/(2n-1) * (1 - p^2 - q^2) is averaged over loci, where n is the mean number of genotyped individuals across loci (loci with no data in the population are excluded).
Value
A named vector with the mean expected heterozygosity for each population
Author(s)
Custodian: Luis Mijangos (Post to https://groups.google.com/d/forum/dartr)
See Also
Other utilities:
gl.He(),
gl.Ho(),
gl.alf(),
utils.allelic.richness(),
utils.basic.stats(),
utils.check.datatype(),
utils.collapse.matrix(),
utils.dart2genlight(),
utils.dist.binary(),
utils.fbm.amat(),
utils.fbm.blocks(),
utils.fbm.colblocks(),
utils.fbm.colwise(),
utils.fbm.copy(),
utils.fbm.count.mean(),
utils.fbm.decode(),
utils.fbm.grm(),
utils.fbm.has(),
utils.fbm.new(),
utils.fbm.pair.counts(),
utils.fbm.reader(),
utils.fbm.rowwise(),
utils.fbm.tempfile(),
utils.flag.start(),
utils.history.call(),
utils.is.fixed(),
utils.jackknife(),
utils.n.var.invariant(),
utils.plot.save(),
utils.read.fasta(),
utils.read.ped(),
utils.recalc.avgpic(),
utils.recalc.callrate(),
utils.recalc.freqhets(),
utils.recalc.freqhomref(),
utils.recalc.freqhomsnp(),
utils.recalc.maf(),
utils.reset.flags(),
utils.transpose(),
utils.vcf.depth(),
utils.vcfr2genlight.polyploid()
Compacts a call before it is stored in the history of an object
Description
WARNING: UTILITY SCRIPTS ARE FOR INTERNAL USE ONLY AND SHOULD NOT BE USED BY END USERS AS THEIR USE OUT OF CONTEXT COULD LEAD TO UNPREDICTABLE OUTCOMES.
A call from match.call() holds the arguments as they were written, usually names (e.g. x = gl). When the function is called through do.call(fun, list(x = gl, ...)) the call holds the evaluated arguments instead: the whole input object, which itself carries its history, so the history grows with every such step. The returned call keeps names, expressions and small values (atomic vectors of up to 20 elements), and replaces any other value with a short label such as '<dartR: 250 ind x 255 loc>'. A function given as the value of the call head is replaced by its name.
Usage
utils.history.call(call)
Arguments
call |
A call, typically match.call() of the calling function [required]. |
Value
The compacted call.
Author(s)
Custodian: Bernd Gruber – Post to https://groups.google.com/d/forum/dartr
See Also
Other utilities:
gl.He(),
gl.Ho(),
gl.alf(),
utils.allelic.richness(),
utils.basic.stats(),
utils.check.datatype(),
utils.collapse.matrix(),
utils.dart2genlight(),
utils.dist.binary(),
utils.fbm.amat(),
utils.fbm.blocks(),
utils.fbm.colblocks(),
utils.fbm.colwise(),
utils.fbm.copy(),
utils.fbm.count.mean(),
utils.fbm.decode(),
utils.fbm.grm(),
utils.fbm.has(),
utils.fbm.new(),
utils.fbm.pair.counts(),
utils.fbm.reader(),
utils.fbm.rowwise(),
utils.fbm.tempfile(),
utils.flag.start(),
utils.het.pop(),
utils.is.fixed(),
utils.jackknife(),
utils.n.var.invariant(),
utils.plot.save(),
utils.read.fasta(),
utils.read.ped(),
utils.recalc.avgpic(),
utils.recalc.callrate(),
utils.recalc.freqhets(),
utils.recalc.freqhomref(),
utils.recalc.freqhomsnp(),
utils.recalc.maf(),
utils.reset.flags(),
utils.transpose(),
utils.vcf.depth(),
utils.vcfr2genlight.polyploid()
An internal function to test if two populations are fixed at a given locus
Description
WARNING: UTILITY SCRIPTS ARE FOR INTERNAL USE ONLY AND SHOULD NOT BE USED BY END USERS AS THEIR USE OUT OF CONTEXT COULD LEAD TO UNPREDICTABLE OUTCOMES.
Usage
utils.is.fixed(s1, s2, tloc = 0)
Arguments
s1 |
Percentage SNP allele or sequence tag frequency for the first population [required]. |
s2 |
Percentage SNP allele or sequence tag frequency for the second population [required]. |
tloc |
Threshold value for tolerance in when a difference is regarded as fixed [default 0]. |
Details
This script compares two percent allele frequencies and reports 1 if they represent a fixed difference, 0 otherwise.
A fixed difference at a locus occurs when two populations share no alleles, noting that SNPs are biallelic (ploidy=2). Tolerance in the definition of a fixed difference is provided by the t parameter. For example, t=0.05 means that SNP allele frequencies of 95,5 and 5,95 percent will be reported as fixed (TRUE).
Value
1 (fixed difference), 0 (alleles shared) or NA (one or both of s1 or s2 missing); numeric, so callers can sum or threshold the result
Author(s)
Maintainer: Arthur Georges (Post to https://groups.google.com/d/forum/dartr)
See Also
Other utilities:
gl.He(),
gl.Ho(),
gl.alf(),
utils.allelic.richness(),
utils.basic.stats(),
utils.check.datatype(),
utils.collapse.matrix(),
utils.dart2genlight(),
utils.dist.binary(),
utils.fbm.amat(),
utils.fbm.blocks(),
utils.fbm.colblocks(),
utils.fbm.colwise(),
utils.fbm.copy(),
utils.fbm.count.mean(),
utils.fbm.decode(),
utils.fbm.grm(),
utils.fbm.has(),
utils.fbm.new(),
utils.fbm.pair.counts(),
utils.fbm.reader(),
utils.fbm.rowwise(),
utils.fbm.tempfile(),
utils.flag.start(),
utils.het.pop(),
utils.history.call(),
utils.jackknife(),
utils.n.var.invariant(),
utils.plot.save(),
utils.read.fasta(),
utils.read.ped(),
utils.recalc.avgpic(),
utils.recalc.callrate(),
utils.recalc.freqhets(),
utils.recalc.freqhomref(),
utils.recalc.freqhomsnp(),
utils.recalc.maf(),
utils.reset.flags(),
utils.transpose(),
utils.vcf.depth(),
utils.vcfr2genlight.polyploid()
An internal function to conduct jackknife resampling using a genlight object
Description
WARNING: UTILITY SCRIPTS ARE FOR INTERNAL USE ONLY AND SHOULD NOT BE USED BY END USERS AS THEIR USE OUT OF CONTEXT COULD LEAD TO UNPREDICTABLE OUTCOMES.
Usage
utils.jackknife(
x,
FUN,
unit = "loc",
recalc = FALSE,
mono.rm = FALSE,
n.cores = 1,
verbose = NULL,
...
)
Arguments
x |
Name of the genlight object [required]. |
FUN |
the name of the function to be used to calculate the statistic (for n.cores > 1 it must be reachable on the worker processes, i.e. exported by dartR.base or an attached package) |
unit |
The unit to use for resampling. One of c("loc", "ind", "pop"): loci, individuals or populations |
recalc |
If TRUE, recalculate the locus metadata statistics [default FALSE]. |
mono.rm |
If TRUE, remove monomorphic and all NA loci [default FALSE]. |
n.cores |
The number of cores to use. If "auto", it will use all but one available cores. |
verbose |
Verbosity: 0, silent or fatal errors; 1, begin and end; 2, progress but not results; 3, progress and results summary; 5, full report [default 2 or as specified using gl.set.verbosity]. |
... |
any additional arguments to be passed to FUN |
Details
Jackknife resampling is a statistical procedure where for a dataset of sample
size n, subsamples of size n-1 are used to compute a statistic. The collection
of the values obtained can be used to evaluate the variability around the point
estimate. This function can take the loci, the individuals or the populations
as units over which to conduct resampling.
Note: when n is very small, jackknife resampling is not recommended.
Parallel computation is implemented. The argument n.cores indicates the
number of core to use. If "auto", it will use all but one available
cores. If the number of units is small (e.g. a few populations), there is not
real advantage in using parallel computation. On the other hand, if the number
of units is large (e.g. thousands of loci), even with parallel computation,
this function can be very slow.
Value
A list of length n where each element is the output of FUN
Author(s)
Custodian: Carlo Pacioni – Post to https://groups.google.com/d/forum/dartr
See Also
Other utilities:
gl.He(),
gl.Ho(),
gl.alf(),
utils.allelic.richness(),
utils.basic.stats(),
utils.check.datatype(),
utils.collapse.matrix(),
utils.dart2genlight(),
utils.dist.binary(),
utils.fbm.amat(),
utils.fbm.blocks(),
utils.fbm.colblocks(),
utils.fbm.colwise(),
utils.fbm.copy(),
utils.fbm.count.mean(),
utils.fbm.decode(),
utils.fbm.grm(),
utils.fbm.has(),
utils.fbm.new(),
utils.fbm.pair.counts(),
utils.fbm.reader(),
utils.fbm.rowwise(),
utils.fbm.tempfile(),
utils.flag.start(),
utils.het.pop(),
utils.history.call(),
utils.is.fixed(),
utils.n.var.invariant(),
utils.plot.save(),
utils.read.fasta(),
utils.read.ped(),
utils.recalc.avgpic(),
utils.recalc.callrate(),
utils.recalc.freqhets(),
utils.recalc.freqhomref(),
utils.recalc.freqhomsnp(),
utils.recalc.maf(),
utils.reset.flags(),
utils.transpose(),
utils.vcf.depth(),
utils.vcfr2genlight.polyploid()
Examples
require("dartR.data")
platMod.gl <- gl.filter.allna(platypus.gl)
chk.pop <- utils.jackknife(x=platMod.gl, FUN="gl.alf", unit="pop",
recalc = FALSE, mono.rm = FALSE, n.cores = 1, verbose=0)
An internal utility function to calculate the number of variant and invariant sites by locus
Description
WARNING: UTILITY SCRIPTS ARE FOR INTERNAL USE ONLY AND SHOULD NOT BE USED BY END USERS AS THEIR USE OUT OF CONTEXT COULD LEAD TO UNPREDICTABLE OUTCOMES.
Usage
utils.n.var.invariant(x, verbose = NULL)
Arguments
x |
Name of the genlight object containing the SNP data [required]. |
verbose |
Verbosity: 0, silent or fatal errors; 1, begin and end; 2, progress log; 3, progress and results summary; 5, full report [default 2 or as specified using gl.set.verbosity]. |
Details
Calculate the number of variant and invariant sites by locus and add them as
columns in loc.metrics. This can be useful to conduct further
filtering, for example where only loci with secondaries are wanted for
phylogenetic analyses.
Invariant sites are the sites (nucleotide) that are not polymorphic. When the
locus metadata supplied by DArT includes the sequence of the allele
(TrimmedSequence), it is used by this function to estimate the number
of sites that were sequenced in each tag (read). This script then subtracts
the number of polymorphic sites. The length of the trimmed sequence
(lenTrimSeq), the number of variant (n.variant) and
invariant (n.invariant) sites are the added to the table in
gl@others$loc.metrics.
NOTE: It is important to realise that this function correctly
estimates the number of variant and invariant sites only when it is executed on
genlight objects before secondaries are removed.
Value
The modified genlight object.
Author(s)
Custodian: Carlo Pacioni (Post to https://groups.google.com/d/forum/dartr)
See Also
gl.filter.secondaries,gl.report.heterozygosity
Other utilities:
gl.He(),
gl.Ho(),
gl.alf(),
utils.allelic.richness(),
utils.basic.stats(),
utils.check.datatype(),
utils.collapse.matrix(),
utils.dart2genlight(),
utils.dist.binary(),
utils.fbm.amat(),
utils.fbm.blocks(),
utils.fbm.colblocks(),
utils.fbm.colwise(),
utils.fbm.copy(),
utils.fbm.count.mean(),
utils.fbm.decode(),
utils.fbm.grm(),
utils.fbm.has(),
utils.fbm.new(),
utils.fbm.pair.counts(),
utils.fbm.reader(),
utils.fbm.rowwise(),
utils.fbm.tempfile(),
utils.flag.start(),
utils.het.pop(),
utils.history.call(),
utils.is.fixed(),
utils.jackknife(),
utils.plot.save(),
utils.read.fasta(),
utils.read.ped(),
utils.recalc.avgpic(),
utils.recalc.callrate(),
utils.recalc.freqhets(),
utils.recalc.freqhomref(),
utils.recalc.freqhomsnp(),
utils.recalc.maf(),
utils.reset.flags(),
utils.transpose(),
utils.vcf.depth(),
utils.vcfr2genlight.polyploid()
Reads a PLINK .ped fileset with PLINK allele orientation
Description
WARNING: UTILITY SCRIPTS ARE FOR INTERNAL USE ONLY AND SHOULD NOT BE USED BY END USERS AS THEIR USE OUT OF CONTEXT COULD LEAD TO UNPREDICTABLE OUTCOMES.
Usage
utils.ped2plink(ped, map = NULL)
Arguments
ped |
Path to the .ped file [required]. |
map |
Path to the matching .map file, or NULL when there is none. Without a .map, loci are named locus.1, locus.2, ... and chromosome and position are set to NA [default NULL]. |
Details
Reads a PLINK text fileset (.ped, optionally with a .map) in R with
utils.read.ped, with no PLINK executable required, and
returns the same three components as snpStats::read.plink() so
that gl.read.PLINK can treat text and binary input
identically.
utils.read.ped codes alleles in order of first appearance in the
file. PLINK 1.x instead makes the minor allele A1 and the major allele
A2, and on a tie the first-encountered allele becomes A2. Alleles are
switched here per locus to match that rule, so the genotype dosage
(count of allele.2) is the same as that obtained from a .bed fileset
written by plink --make-bed from the same .ped. Loci are kept in
file order, whereas plink --make-bed sorts them by chromosome
and position, so the two can differ in locus order. PLINK's chromosome
code 0 (unmapped) is returned as NA, as snpStats::read.plink
does for a .bim.
Value
A list with genotypes (a SnpMatrix), fam (a
data.frame with pedigree, member, father, mother, sex, affected) and
map (a data.frame with chromosome, snp.name, cM, position,
allele.1, allele.2, one row per locus, row names = snp.name).
Author(s)
Custodian: Luis Mijangos (Post to https://groups.google.com/d/forum/dartr)
Runs PLINK from within R
Description
Runs PLINK from within R.
Usage
utils.plink.run(
dir.in,
plink.cmd = "plink",
plink.path = "path",
out = "hapmap1",
syntax,
verbose = NULL
)
Arguments
dir.in |
The path where the data files are |
plink.cmd |
The 'name' to call plink. This will depend on the file name (without the extension '.exe' if on windows) or the name of the PATH variable |
plink.path |
The path where the executable is. If plink is listed in the PATH then there is no need for this. This is what the option "path" means |
out |
The root of the output file name |
syntax |
the flags to pass to plink call; any file names in it must
be quoted by the caller (e.g. with |
verbose |
Verbosity: 0, silent or fatal errors; 1, begin and end; 2, progress log; 3, progress and results summary; 5, full report [default NULL]. |
Details
PLINK needs to be installed on the machine and syntax used need to be appropriate for the version installed.
Value
A character vector with the command used for PLINK. Stops with an error, quoting PLINK's output, when PLINK exits with an error.
Author(s)
Custodian: Carlo Pacioni and Luis Mijangos (Post to https://groups.google.com/d/forum/dartr)
References
Purcell, Shaun, et al. 'PLINK: a tool set for whole-genome association and population-based linkage analyses.' The American journal of human genetics 81.3 (2007): 559-575.
An internal function to save a ggplot object to disk in RDS binary format
Description
WARNING: UTILITY SCRIPTS ARE FOR INTERNAL USE ONLY AND SHOULD NOT BE USED BY END USERS AS THEIR USE OUT OF CONTEXT COULD LEAD TO UNPREDICTABLE OUTCOMES.
Usage
utils.plot.save(x, dir = NULL, file = NULL, verbose = NULL, ...)
Arguments
x |
Name of the ggplot object. |
dir |
Name of the directory to save the file. |
file |
Name of the file to save the plot to (omit file extension) |
verbose |
Verbosity: 0, silent or fatal errors; 1, begin and end; 2, progress log; 3, progress and results summary; 5, full report [default NULL, unless specified using gl.set.verbosity] |
... |
Ignored; retained for call compatibility. |
Details
An internal function to save a ggplot object to disk in RDS binary format. Uses saveRDS() to save the file with an .RDS extension; can be reloaded with gl.load().
Value
NULL, invisibly
Author(s)
Custodian: Arthur Georges (Post to https://groups.google.com/d/forum/dartr)
See Also
Other utilities:
gl.He(),
gl.Ho(),
gl.alf(),
utils.allelic.richness(),
utils.basic.stats(),
utils.check.datatype(),
utils.collapse.matrix(),
utils.dart2genlight(),
utils.dist.binary(),
utils.fbm.amat(),
utils.fbm.blocks(),
utils.fbm.colblocks(),
utils.fbm.colwise(),
utils.fbm.copy(),
utils.fbm.count.mean(),
utils.fbm.decode(),
utils.fbm.grm(),
utils.fbm.has(),
utils.fbm.new(),
utils.fbm.pair.counts(),
utils.fbm.reader(),
utils.fbm.rowwise(),
utils.fbm.tempfile(),
utils.flag.start(),
utils.het.pop(),
utils.history.call(),
utils.is.fixed(),
utils.jackknife(),
utils.n.var.invariant(),
utils.read.fasta(),
utils.read.ped(),
utils.recalc.avgpic(),
utils.recalc.callrate(),
utils.recalc.freqhets(),
utils.recalc.freqhomref(),
utils.recalc.freqhomsnp(),
utils.recalc.maf(),
utils.reset.flags(),
utils.transpose(),
utils.vcf.depth(),
utils.vcfr2genlight.polyploid()
Utility to import DarT data to R
Description
WARNING: UTILITY SCRIPTS ARE FOR INTERNAL USE ONLY AND SHOULD NOT BE USED BY END USERS AS THEIR USE OUT OF CONTEXT COULD LEAD TO UNPREDICTABLE OUTCOMES.
Usage
utils.read.dart(
filename,
nas = "-",
topskip = NULL,
lastmetric = "RepAvg",
service.row = 1,
plate.row = 3,
verbose = NULL
)
Arguments
filename |
Path to file (csv file only currently) [required]. |
nas |
A character specifying NAs [default '-']. |
topskip |
A number specifying the number of rows to be skipped. If not provided the number of rows to be skipped are 'guessed' by the number of rows with '*' at the beginning [default NULL]. |
lastmetric |
Specifies the last non genetic column [default 'RepAvg']. Be sure to check if that is true, otherwise the number of individuals will not match. You can also specify the last column by a number. |
service.row |
The row number in which the information of the DArT service is contained [default 1]. |
plate.row |
The row number in which the information of the plate location is contained [default 3]. |
verbose |
Verbosity: 0, silent or fatal errors; 1, begin and end; 2, progress log ; 3, progress and results summary; 5, full report [default NULL]. |
Details
Internal function called by gl.read.dart()
Value
A list of length 5. #dart format (one or two rows) #individuals, #snps, #non genetic metrics, #genetic data (still two line format, rows=snps, columns=individuals)
Author(s)
Custodian: Bernd Gruber (Post to https://groups.google.com/d/forum/dartr)
See Also
Other io:
gl.load(),
gl.read.PLINK(),
gl.read.csv(),
gl.read.dart(),
gl.read.fasta(),
gl.read.silicodart(),
gl.save(),
gl.write.csv()
An internal script to read a fastA file into a genlight object
Description
WARNING: UTILITY SCRIPTS ARE FOR INTERNAL USE ONLY AND SHOULD NOT BE USED BY END USERS AS THEIR USE OUT OF CONTEXT COULD LEAD TO UNPREDICTABLE OUTCOMES.
Usage
utils.read.fasta(file, parallel = FALSE, n.cores = NULL, verbose = NULL)
Arguments
file |
Name of the fastA file [required] |
parallel |
Switch to deactivate parallel version. It might not be worth to run it parallel most of the times [default FALSE] |
n.cores |
Number of cores to use if parallel = TRUE; if NULL, all the available cores are used [default NULL] |
verbose |
Verbosity: 0, silent, fatal errors only; 1, flag function begin and end; 2, progress log; 3, progress and results summary; 5, full report [default 2 or as specified using gl.set.verbosity]. |
Value
The resultant genlight object
Author(s)
Custodian: Luis Mijangos (Post to https://groups.google.com/d/forum/dartr)
See Also
Other utilities:
gl.He(),
gl.Ho(),
gl.alf(),
utils.allelic.richness(),
utils.basic.stats(),
utils.check.datatype(),
utils.collapse.matrix(),
utils.dart2genlight(),
utils.dist.binary(),
utils.fbm.amat(),
utils.fbm.blocks(),
utils.fbm.colblocks(),
utils.fbm.colwise(),
utils.fbm.copy(),
utils.fbm.count.mean(),
utils.fbm.decode(),
utils.fbm.grm(),
utils.fbm.has(),
utils.fbm.new(),
utils.fbm.pair.counts(),
utils.fbm.reader(),
utils.fbm.rowwise(),
utils.fbm.tempfile(),
utils.flag.start(),
utils.het.pop(),
utils.history.call(),
utils.is.fixed(),
utils.jackknife(),
utils.n.var.invariant(),
utils.plot.save(),
utils.read.ped(),
utils.recalc.avgpic(),
utils.recalc.callrate(),
utils.recalc.freqhets(),
utils.recalc.freqhomref(),
utils.recalc.freqhomsnp(),
utils.recalc.maf(),
utils.reset.flags(),
utils.transpose(),
utils.vcf.depth(),
utils.vcfr2genlight.polyploid()
Reads a PLINK .ped file into a SnpMatrix with family and map data
Description
WARNING: UTILITY SCRIPTS ARE FOR INTERNAL USE ONLY AND SHOULD NOT BE USED BY END USERS AS THEIR USE OUT OF CONTEXT COULD LEAD TO UNPREDICTABLE OUTCOMES.
Usage
utils.read.ped(
file,
snps,
which,
split = "\t| +",
sep = ".",
na.strings = "0",
lex.order = FALSE,
show_warnings = TRUE
)
Arguments
file |
Name of the .ped file to read (plain text or gzipped) [required]. |
snps |
Either the name of the associated .map file, or a character vector of locus names (one per locus) [optional; if missing, loci are named locus.1, locus.2, ...]. |
which |
When snps is a map file, the column of that file holding the locus names [optional; defaults to the first column with no duplicates]. |
split |
Regular expression used to split fields on each line [default "\t| +", i.e. tabs and spaces]. |
sep |
Separator used when constructing locus and subject names [default "."]. |
na.strings |
Strings to be treated as missing values. Note that the default treats the conventional PLINK missing-allele code as missing [default "0"]. |
lex.order |
If TRUE, alleles at each locus are reordered lexicographically, and the genotype codes are switched to match [default FALSE]. |
show_warnings |
If FALSE, the warnings for no-data, monomorphic and multi-allelic loci are suppressed. The multi-allelic NA reset is applied regardless [default TRUE]. |
Details
A vendored, lightly modified copy of snpStats::read.pedfile. The
file is read twice: a first pass counts the lines, a second parses each
line into the six pedigree columns and the genotype allele pairs. For
each locus the first allele encountered in file order becomes
allele.1 and the second becomes allele.2; genotypes are
coded on that basis (raw SnpMatrix coding; as numeric, the count of
allele.2). Loci at which more than two alleles are observed are
set entirely to NA. The only in-package caller is
gl.report.ld.map.
Value
A list with elements: genotypes (a
snpStats::SnpMatrix, individuals x loci), fam (a data
frame with pedigree, member, father, mother, sex, affected) and
map (a data frame with the locus names and alleles, plus the
.map columns when one was supplied).
Author(s)
Custodian: Luis Mijangos (Post to https://groups.google.com/d/forum/dartr)
See Also
Other utilities:
gl.He(),
gl.Ho(),
gl.alf(),
utils.allelic.richness(),
utils.basic.stats(),
utils.check.datatype(),
utils.collapse.matrix(),
utils.dart2genlight(),
utils.dist.binary(),
utils.fbm.amat(),
utils.fbm.blocks(),
utils.fbm.colblocks(),
utils.fbm.colwise(),
utils.fbm.copy(),
utils.fbm.count.mean(),
utils.fbm.decode(),
utils.fbm.grm(),
utils.fbm.has(),
utils.fbm.new(),
utils.fbm.pair.counts(),
utils.fbm.reader(),
utils.fbm.rowwise(),
utils.fbm.tempfile(),
utils.flag.start(),
utils.het.pop(),
utils.history.call(),
utils.is.fixed(),
utils.jackknife(),
utils.n.var.invariant(),
utils.plot.save(),
utils.read.fasta(),
utils.recalc.avgpic(),
utils.recalc.callrate(),
utils.recalc.freqhets(),
utils.recalc.freqhomref(),
utils.recalc.freqhomsnp(),
utils.recalc.maf(),
utils.reset.flags(),
utils.transpose(),
utils.vcf.depth(),
utils.vcfr2genlight.polyploid()
A utility function to recalculate intermediate locus metrics
Description
WARNING: UTILITY SCRIPTS ARE FOR INTERNAL USE ONLY AND SHOULD NOT BE USED BY END USERS AS THEIR USE OUT OF CONTEXT COULD LEAD TO UNPREDICTABLE OUTCOMES.
Usage
utils.recalc.avgpic(x, verbose = NULL)
Arguments
x |
Name of the genlight [required]. |
verbose |
Verbosity: 0, silent or fatal errors; 1, begin and end; 2, progress log; 3, progress and results summary; 5, full report [default 2 or as specified using gl.set.verbosity] |
Details
Recalculates OneRatioRef, OneRatioSnp, PICRef, PICSnp, and AvgPIC by locus after some individuals or populations have been deleted.
The locus metadata supplied by DArT has OneRatioRef, OneRatioSnp, PICRef, PICSnp, and AvgPIC included, but the allelic composition will change when some individuals,or populations, are removed from the dataset and so the initial statistics will no longer apply. This script recalculates these statistics and places the recalculated values in the appropriate place in the genlight object. If the locus metadata OneRatioRef|Snp, PICRef|Snp and/or AvgPIC do not exist, the script creates and populates them.
Value
The modified genlight object.
Author(s)
Custodian: Luis Mijangos (Post to https://groups.google.com/d/forum/dartr)
See Also
gl.recalc.metrics for recalculating all
locus metrics
Other utilities:
gl.He(),
gl.Ho(),
gl.alf(),
utils.allelic.richness(),
utils.basic.stats(),
utils.check.datatype(),
utils.collapse.matrix(),
utils.dart2genlight(),
utils.dist.binary(),
utils.fbm.amat(),
utils.fbm.blocks(),
utils.fbm.colblocks(),
utils.fbm.colwise(),
utils.fbm.copy(),
utils.fbm.count.mean(),
utils.fbm.decode(),
utils.fbm.grm(),
utils.fbm.has(),
utils.fbm.new(),
utils.fbm.pair.counts(),
utils.fbm.reader(),
utils.fbm.rowwise(),
utils.fbm.tempfile(),
utils.flag.start(),
utils.het.pop(),
utils.history.call(),
utils.is.fixed(),
utils.jackknife(),
utils.n.var.invariant(),
utils.plot.save(),
utils.read.fasta(),
utils.read.ped(),
utils.recalc.callrate(),
utils.recalc.freqhets(),
utils.recalc.freqhomref(),
utils.recalc.freqhomsnp(),
utils.recalc.maf(),
utils.reset.flags(),
utils.transpose(),
utils.vcf.depth(),
utils.vcfr2genlight.polyploid()
A utility script to recalculate the callrate by locus after some individuals or populations have been deleted
Description
WARNING: UTILITY SCRIPTS ARE FOR INTERNAL USE ONLY AND SHOULD NOT BE USED BY END USERS AS THEIR USE OUT OF CONTEXT COULD LEAD TO UNPREDICTABLE OUTCOMES.
Usage
utils.recalc.callrate(x, verbose = NULL)
Arguments
x |
Name of the genlight object containing the SNP data [required]. |
verbose |
Verbosity: 0, silent or fatal errors; 1, begin and end; 2, progress log; 3, progress and results summary; 5, full report [default 2 or as specified using gl.set.verbosity] |
Details
SNP datasets generated by DArT have missing values primarily arising from failure to call a SNP because of a mutation at one or both of the restriction enzyme recognition sites. The locus metadata supplied by DArT has callrate included, but the call rate will change when some individuals are removed from the dataset. This script recalculates the callrate and places these recalculated values in the appropriate place in the genlight object. It sets the Call Rate flag to TRUE.
Value
The modified genlight object
Author(s)
Custodian: Luis Mijangos (Post to https://groups.google.com/d/forum/dartr)
See Also
gl.recalc.metrics for recalculating all
locus metrics
Other utilities:
gl.He(),
gl.Ho(),
gl.alf(),
utils.allelic.richness(),
utils.basic.stats(),
utils.check.datatype(),
utils.collapse.matrix(),
utils.dart2genlight(),
utils.dist.binary(),
utils.fbm.amat(),
utils.fbm.blocks(),
utils.fbm.colblocks(),
utils.fbm.colwise(),
utils.fbm.copy(),
utils.fbm.count.mean(),
utils.fbm.decode(),
utils.fbm.grm(),
utils.fbm.has(),
utils.fbm.new(),
utils.fbm.pair.counts(),
utils.fbm.reader(),
utils.fbm.rowwise(),
utils.fbm.tempfile(),
utils.flag.start(),
utils.het.pop(),
utils.history.call(),
utils.is.fixed(),
utils.jackknife(),
utils.n.var.invariant(),
utils.plot.save(),
utils.read.fasta(),
utils.read.ped(),
utils.recalc.avgpic(),
utils.recalc.freqhets(),
utils.recalc.freqhomref(),
utils.recalc.freqhomsnp(),
utils.recalc.maf(),
utils.reset.flags(),
utils.transpose(),
utils.vcf.depth(),
utils.vcfr2genlight.polyploid()
A utility script to recalculate the frequency of the heterozygous SNPs by locus after some populations have been deleted
Description
WARNING: UTILITY SCRIPTS ARE FOR INTERNAL USE ONLY AND SHOULD NOT BE USED BY END USERS AS THEIR USE OUT OF CONTEXT COULD LEAD TO UNPREDICTABLE OUTCOMES.
Usage
utils.recalc.freqhets(x, verbose = NULL)
Arguments
x |
Name of the genlight object containing the SNP data [required]. |
verbose |
Verbosity: 0, silent or fatal errors; 1, begin and end; 2, progress log; 3, progress and results summary; 5, full report [default 2 or as specified using gl.set.verbosity] |
Details
The locus metadata supplied by DArT has FreqHets included, but the frequency of the heterozygotes will change when some individuals are removed from the dataset. This script recalculates the FreqHets and places these recalculated values in the appropriate place in the genlight object. Note that the frequency of the heterozygotes is calculated from the individuals that could be scored.
Value
The modified genlight object.
Author(s)
Custodian: Luis Mijangos (Post to https://groups.google.com/d/forum/dartr)
See Also
gl.recalc.metrics for recalculating all
locus metrics
Other utilities:
gl.He(),
gl.Ho(),
gl.alf(),
utils.allelic.richness(),
utils.basic.stats(),
utils.check.datatype(),
utils.collapse.matrix(),
utils.dart2genlight(),
utils.dist.binary(),
utils.fbm.amat(),
utils.fbm.blocks(),
utils.fbm.colblocks(),
utils.fbm.colwise(),
utils.fbm.copy(),
utils.fbm.count.mean(),
utils.fbm.decode(),
utils.fbm.grm(),
utils.fbm.has(),
utils.fbm.new(),
utils.fbm.pair.counts(),
utils.fbm.reader(),
utils.fbm.rowwise(),
utils.fbm.tempfile(),
utils.flag.start(),
utils.het.pop(),
utils.history.call(),
utils.is.fixed(),
utils.jackknife(),
utils.n.var.invariant(),
utils.plot.save(),
utils.read.fasta(),
utils.read.ped(),
utils.recalc.avgpic(),
utils.recalc.callrate(),
utils.recalc.freqhomref(),
utils.recalc.freqhomsnp(),
utils.recalc.maf(),
utils.reset.flags(),
utils.transpose(),
utils.vcf.depth(),
utils.vcfr2genlight.polyploid()
An internal utility function to recalculate the frequency of the homozygous reference SNP by locus after some individuals or populations have been deleted
Description
WARNING: UTILITY SCRIPTS ARE FOR INTERNAL USE ONLY AND SHOULD NOT BE USED BY END USERS AS THEIR USE OUT OF CONTEXT COULD LEAD TO UNPREDICTABLE OUTCOMES.
Usage
utils.recalc.freqhomref(x, verbose = NULL)
Arguments
x |
Name of the genlight [required]. |
verbose |
Verbosity: 0, silent or fatal errors; 1, begin and end; 2, progress log; 3, progress and results summary; 5, full report [default 2 or as specified using gl.set.verbosity] |
Details
The locus metadata supplied by DArT has FreqHomRef included, but the frequency of the homozygous reference will change when some individuals are removed from the dataset. This script recalculates the FreqHomRef and places these recalculated values in the appropriate place in the genlight object. Note that the frequency of the homozygote reference SNPS is calculated from the individuals that could be scored.
Value
The modified genlight object
Author(s)
Custodian: Luis Mijangos (Post to https://groups.google.com/d/forum/dartr)
See Also
gl.recalc.metrics for recalculating all
locus metrics
Other utilities:
gl.He(),
gl.Ho(),
gl.alf(),
utils.allelic.richness(),
utils.basic.stats(),
utils.check.datatype(),
utils.collapse.matrix(),
utils.dart2genlight(),
utils.dist.binary(),
utils.fbm.amat(),
utils.fbm.blocks(),
utils.fbm.colblocks(),
utils.fbm.colwise(),
utils.fbm.copy(),
utils.fbm.count.mean(),
utils.fbm.decode(),
utils.fbm.grm(),
utils.fbm.has(),
utils.fbm.new(),
utils.fbm.pair.counts(),
utils.fbm.reader(),
utils.fbm.rowwise(),
utils.fbm.tempfile(),
utils.flag.start(),
utils.het.pop(),
utils.history.call(),
utils.is.fixed(),
utils.jackknife(),
utils.n.var.invariant(),
utils.plot.save(),
utils.read.fasta(),
utils.read.ped(),
utils.recalc.avgpic(),
utils.recalc.callrate(),
utils.recalc.freqhets(),
utils.recalc.freqhomsnp(),
utils.recalc.maf(),
utils.reset.flags(),
utils.transpose(),
utils.vcf.depth(),
utils.vcfr2genlight.polyploid()
A utility function to recalculate the frequency of the homozygous alternate SNP by locus after some populations have been deleted
Description
WARNING: UTILITY SCRIPTS ARE FOR INTERNAL USE ONLY AND SHOULD NOT BE USED BY END USERS AS THEIR USE OUT OF CONTEXT COULD LEAD TO UNPREDICTABLE OUTCOMES.
Usage
utils.recalc.freqhomsnp(x, verbose = NULL)
Arguments
x |
Name of the genlight object [required]. |
verbose |
Verbosity: 0, silent or fatal errors; 1, begin and end; 2, progress log; 3, progress and results summary; 5, full report [default 2 or as specified using gl.set.verbosity] |
Details
The locus metadata supplied by DArT has FreqHomSnp included, but the frequency of the homozygous alternate will change when some individuals are removed from the dataset. This function recalculates the FreqHomSnp and places these recalculated values in the appropriate place in the genlight object. Note that the frequency of the homozygote alternate SNPS is calculated from the individuals that could be scored. This function only applies to SNP genotype data not Tag P/A data (SilicoDArT).
Value
The modified genlight object.
Author(s)
Custodian: Luis Mijangos (Post to https://groups.google.com/d/forum/dartr)
See Also
gl.recalc.metrics for recalculating all
locus metrics
Other utilities:
gl.He(),
gl.Ho(),
gl.alf(),
utils.allelic.richness(),
utils.basic.stats(),
utils.check.datatype(),
utils.collapse.matrix(),
utils.dart2genlight(),
utils.dist.binary(),
utils.fbm.amat(),
utils.fbm.blocks(),
utils.fbm.colblocks(),
utils.fbm.colwise(),
utils.fbm.copy(),
utils.fbm.count.mean(),
utils.fbm.decode(),
utils.fbm.grm(),
utils.fbm.has(),
utils.fbm.new(),
utils.fbm.pair.counts(),
utils.fbm.reader(),
utils.fbm.rowwise(),
utils.fbm.tempfile(),
utils.flag.start(),
utils.het.pop(),
utils.history.call(),
utils.is.fixed(),
utils.jackknife(),
utils.n.var.invariant(),
utils.plot.save(),
utils.read.fasta(),
utils.read.ped(),
utils.recalc.avgpic(),
utils.recalc.callrate(),
utils.recalc.freqhets(),
utils.recalc.freqhomref(),
utils.recalc.maf(),
utils.reset.flags(),
utils.transpose(),
utils.vcf.depth(),
utils.vcfr2genlight.polyploid()
A utility function to recalculate the minor allele frequency by locus, typically after some populations have been deleted
Description
WARNING: UTILITY SCRIPTS ARE FOR INTERNAL USE ONLY AND SHOULD NOT BE USED BY END USERS AS THEIR USE OUT OF CONTEXT COULD LEAD TO UNPREDICTABLE OUTCOMES.
Usage
utils.recalc.maf(x, verbose = NULL)
Arguments
x |
Name of the genlight object [required]. |
verbose |
Verbosity: 0, silent or fatal errors; 1, begin and end; 2, progress log; 3, progress and results summary; 5, full report [default 2 or as specified using gl.set.verbosity] |
Details
The locus metadata supplied by DArT does not have MAF included, so it is calculated and added to the locus.metadata by this script. The minimum allele frequency will change when some individuals are removed from the dataset. This script recalculates the MAF and places these recalculated values in the appropriate place in the genlight object. This function only applies to SNP genotype data.
Value
The modified genlight dataset.
Author(s)
Custodian: Luis Mijangos (Post to https://groups.google.com/d/forum/dartr)
See Also
gl.recalc.metrics for recalculating all
locus metrics
Other utilities:
gl.He(),
gl.Ho(),
gl.alf(),
utils.allelic.richness(),
utils.basic.stats(),
utils.check.datatype(),
utils.collapse.matrix(),
utils.dart2genlight(),
utils.dist.binary(),
utils.fbm.amat(),
utils.fbm.blocks(),
utils.fbm.colblocks(),
utils.fbm.colwise(),
utils.fbm.copy(),
utils.fbm.count.mean(),
utils.fbm.decode(),
utils.fbm.grm(),
utils.fbm.has(),
utils.fbm.new(),
utils.fbm.pair.counts(),
utils.fbm.reader(),
utils.fbm.rowwise(),
utils.fbm.tempfile(),
utils.flag.start(),
utils.het.pop(),
utils.history.call(),
utils.is.fixed(),
utils.jackknife(),
utils.n.var.invariant(),
utils.plot.save(),
utils.read.fasta(),
utils.read.ped(),
utils.recalc.avgpic(),
utils.recalc.callrate(),
utils.recalc.freqhets(),
utils.recalc.freqhomref(),
utils.recalc.freqhomsnp(),
utils.reset.flags(),
utils.transpose(),
utils.vcf.depth(),
utils.vcfr2genlight.polyploid()
An internal utility function to reset to FALSE (or TRUE) the locus metric flags after some individuals or populations have been deleted.
Description
WARNING: UTILITY SCRIPTS ARE FOR INTERNAL USE ONLY AND SHOULD NOT BE USED BY END USERS AS THEIR USE OUT OF CONTEXT COULD LEAD TO UNPREDICTABLE OUTCOMES.
Usage
utils.reset.flags(x, set = FALSE, value = 2, verbose = NULL)
Arguments
x |
Name of the genlight object [required]. |
set |
Set the flags to TRUE or FALSE [default FALSE]. |
value |
The default verbosity to store in the object's |
verbose |
Verbosity: 0, silent or fatal errors; 1, begin and end; 2, progress log; 3, progress and results summary; 5, full report [default 2 or as specified using gl.set.verbosity] |
Details
The locus metadata supplied by DArT has OneRatioRef, OneRatioSnp, PICRef, PICSnp, and AvgPIC included, but the allelic composition will change when some individuals are removed from the dataset and so the initial statistics will no longer apply. This applies also to some variable calculated by dartR (e.g. maf). This script resets the locus metrics flags to FALSE to indicate that these statistics in the genlight object are no longer current. The verbosity default is also set, and in the case of SilcoDArT, the flags PIC and OneRatio are also set. If the locus metrics do not exist then they are added to the genlight object but not populated. If the locus metrics flags do not exist, then they are added to the genlight object and set to FALSE (or TRUE).
Value
The modified genlight object
Author(s)
Custodian: Luis Mijangos (Post to https://groups.google.com/d/forum/dartr)
See Also
gl.recalc.metrics for recalculating all
locus metrics
Other utilities:
gl.He(),
gl.Ho(),
gl.alf(),
utils.allelic.richness(),
utils.basic.stats(),
utils.check.datatype(),
utils.collapse.matrix(),
utils.dart2genlight(),
utils.dist.binary(),
utils.fbm.amat(),
utils.fbm.blocks(),
utils.fbm.colblocks(),
utils.fbm.colwise(),
utils.fbm.copy(),
utils.fbm.count.mean(),
utils.fbm.decode(),
utils.fbm.grm(),
utils.fbm.has(),
utils.fbm.new(),
utils.fbm.pair.counts(),
utils.fbm.reader(),
utils.fbm.rowwise(),
utils.fbm.tempfile(),
utils.flag.start(),
utils.het.pop(),
utils.history.call(),
utils.is.fixed(),
utils.jackknife(),
utils.n.var.invariant(),
utils.plot.save(),
utils.read.fasta(),
utils.read.ped(),
utils.recalc.avgpic(),
utils.recalc.callrate(),
utils.recalc.freqhets(),
utils.recalc.freqhomref(),
utils.recalc.freqhomsnp(),
utils.recalc.maf(),
utils.transpose(),
utils.vcf.depth(),
utils.vcfr2genlight.polyploid()
Examples
result <- utils.reset.flags(testset.gl)
An internal utility function to transpose a genlight object.
Description
WARNING: UTILITY SCRIPTS ARE FOR INTERNAL USE ONLY AND SHOULD NOT BE USED BY END USERS AS THEIR USE OUT OF CONTEXT COULD LEAD TO UNPREDICTABLE OUTCOMES.
Usage
utils.transpose(x, parallel = FALSE)
Arguments
x |
name of the genlight object |
parallel |
if TRUE, use parallel processing capability |
Details
This is a function to transpose a genlight object, that is, to set loci as entities and individuals as attributes. Depends on matrix2gen (utils.impute.R). Assumes uniform ploidy.
Value
a transposed genlight object
See Also
Other utilities:
gl.He(),
gl.Ho(),
gl.alf(),
utils.allelic.richness(),
utils.basic.stats(),
utils.check.datatype(),
utils.collapse.matrix(),
utils.dart2genlight(),
utils.dist.binary(),
utils.fbm.amat(),
utils.fbm.blocks(),
utils.fbm.colblocks(),
utils.fbm.colwise(),
utils.fbm.copy(),
utils.fbm.count.mean(),
utils.fbm.decode(),
utils.fbm.grm(),
utils.fbm.has(),
utils.fbm.new(),
utils.fbm.pair.counts(),
utils.fbm.reader(),
utils.fbm.rowwise(),
utils.fbm.tempfile(),
utils.flag.start(),
utils.het.pop(),
utils.history.call(),
utils.is.fixed(),
utils.jackknife(),
utils.n.var.invariant(),
utils.plot.save(),
utils.read.fasta(),
utils.read.ped(),
utils.recalc.avgpic(),
utils.recalc.callrate(),
utils.recalc.freqhets(),
utils.recalc.freqhomref(),
utils.recalc.freqhomsnp(),
utils.recalc.maf(),
utils.reset.flags(),
utils.vcf.depth(),
utils.vcfr2genlight.polyploid()
Utility function to read locus depth, allele read counts and genotype likelihoods from a vcfR object
Description
WARNING: UTILITY SCRIPTS ARE FOR INTERNAL USE ONLY AND SHOULD NOT BE USED BY END USERS AS THEIR USE OUT OF CONTEXT COULD LEAD TO UNPREDICTABLE OUTCOMES.
Usage
utils.vcf.depth(
vcf,
loci = seq_len(nrow(vcf@fix)),
read.counts = FALSE,
likelihoods = FALSE,
chunk = 10000L
)
Arguments
vcf |
A vcfR object [defined in function |
loci |
Indices of the records kept as loci, in the order of the loci in the genlight object [default all records]. |
read.counts |
If TRUE, the reference and alternative read counts of each genotype are also returned [default FALSE]. |
likelihoods |
If TRUE, the likelihoods of the three diploid genotypes of each genotype call are also returned [default FALSE]. |
chunk |
Number of records processed at a time, which bounds the memory used [default 10000]. |
Details
rdepth is the mean of FORMAT DP over the called genotypes of a locus.
Missing and half-missing calls (e.g. ./., 0/.) are not called, as in
utils.vcfr2genlight.polyploid; some callers report DP = 0
for them. A locus without called genotypes or without DP gets NA.
Read counts come from FORMAT AD (first value REF, second ALT). Where a genotype has no AD, they come from FORMAT BSDP (read counts of the bases A, C, G and T, as written by some callers) taken at the REF and ALT bases; records whose REF or ALT is not a single base get NA. Counts are stored as reported, also for uncalled genotypes.
Likelihoods come from FORMAT PL or, for genotypes without PL, from FORMAT GL as round(-10 * GL). They are phred-scaled and shifted so that the most likely genotype has 0; a likelihood of 0 (-inf in GL) becomes the largest integer. A genotype whose likelihoods are missing, do not number three or are all equal (e.g. ./.:0,0,0) gets NA; uncalled genotypes with informative likelihoods keep them.
Value
A list with rdepth (one value per locus, NULL when the vcf has no DP); when read.counts is TRUE, ref.count and alt.count (integer matrices, individuals x loci, NULL when the vcf has neither AD nor BSDP); and when likelihoods is TRUE, pl.ref, pl.het and pl.alt (the phred-scaled likelihoods of 0/0, 0/1 and 1/1, integer matrices of individuals x loci, NULL when the vcf has neither PL nor GL).
Author(s)
Custodian: Luis Mijangos – Post to https://groups.google.com/d/forum/dartr
See Also
Other utilities:
gl.He(),
gl.Ho(),
gl.alf(),
utils.allelic.richness(),
utils.basic.stats(),
utils.check.datatype(),
utils.collapse.matrix(),
utils.dart2genlight(),
utils.dist.binary(),
utils.fbm.amat(),
utils.fbm.blocks(),
utils.fbm.colblocks(),
utils.fbm.colwise(),
utils.fbm.copy(),
utils.fbm.count.mean(),
utils.fbm.decode(),
utils.fbm.grm(),
utils.fbm.has(),
utils.fbm.new(),
utils.fbm.pair.counts(),
utils.fbm.reader(),
utils.fbm.rowwise(),
utils.fbm.tempfile(),
utils.flag.start(),
utils.het.pop(),
utils.history.call(),
utils.is.fixed(),
utils.jackknife(),
utils.n.var.invariant(),
utils.plot.save(),
utils.read.fasta(),
utils.read.ped(),
utils.recalc.avgpic(),
utils.recalc.callrate(),
utils.recalc.freqhets(),
utils.recalc.freqhomref(),
utils.recalc.freqhomsnp(),
utils.recalc.maf(),
utils.reset.flags(),
utils.transpose(),
utils.vcfr2genlight.polyploid()
Examples
## Not run:
depth <- utils.vcf.depth(vcf, read.counts = TRUE, likelihoods = TRUE)
## End(Not run)
Utility function to convert polyploid vcfR object as genlight
Description
WARNING: UTILITY SCRIPTS ARE FOR INTERNAL USE ONLY AND SHOULD NOT BE USED BY END USERS AS THEIR USE OUT OF CONTEXT COULD LEAD TO UNPREDICTABLE OUTCOMES.
Usage
utils.vcfr2genlight.polyploid(x, n.cores = 1, mode2 = "genotype")
Arguments
x |
Name of the vcfR object [defined in function |
n.cores |
Number of cores [default 1] |
mode2 |
genotype: all heterozygous sites will be coded as 1 regardless ploidy level, dosage: sites will be codes as copy number of alternate allele [default 'genotype']. |
Details
This function uses parameters from gl.read.vcf for conversion
The ploidy of each individual is derived from the allele count (arity) of
its genotype calls. Half-missing calls (e.g. 0/., ./1) are treated as
missing data (NA) in both modes.
Please carefully check the data if "dosage" mode is used. (codes were modified from
'vcfR2genlight' in vcfR packge to convert polyploid data)
Value
genlight object
Author(s)
Custodian: Ching Ching Lau – Post to https://groups.google.com/d/forum/dartr
References
Knaus, B. J., & Grunwald, N. J. (2017). vcfr: a package to manipulate and visualize variant call format data in R. Molecular ecology resources, 17(1), 44-53.
Knaus, B. J., Grunwald, N. J., Anderson, E. C., Winter, D. J., Kamvar, Z. N., & Tabima, J. F. (2023). Package 'vcfR'. vcfR
See Also
Other utilities:
gl.He(),
gl.Ho(),
gl.alf(),
utils.allelic.richness(),
utils.basic.stats(),
utils.check.datatype(),
utils.collapse.matrix(),
utils.dart2genlight(),
utils.dist.binary(),
utils.fbm.amat(),
utils.fbm.blocks(),
utils.fbm.colblocks(),
utils.fbm.colwise(),
utils.fbm.copy(),
utils.fbm.count.mean(),
utils.fbm.decode(),
utils.fbm.grm(),
utils.fbm.has(),
utils.fbm.new(),
utils.fbm.pair.counts(),
utils.fbm.reader(),
utils.fbm.rowwise(),
utils.fbm.tempfile(),
utils.flag.start(),
utils.het.pop(),
utils.history.call(),
utils.is.fixed(),
utils.jackknife(),
utils.n.var.invariant(),
utils.plot.save(),
utils.read.fasta(),
utils.read.ped(),
utils.recalc.avgpic(),
utils.recalc.callrate(),
utils.recalc.freqhets(),
utils.recalc.freqhomref(),
utils.recalc.freqhomsnp(),
utils.recalc.maf(),
utils.reset.flags(),
utils.transpose(),
utils.vcf.depth()
Examples
## Not run:
datatype <- utils.vcfr2genlight.polyploid(x=vcfr, mode2="genotype")
## End(Not run)
Setting up the package Setting theme, colors and verbosity
Description
Setting up the package Setting theme, colors and verbosity
Usage
zzz
Format
An object of class NULL of length 0.